Home/ Comparisons/ Olo Alternatives

Olo Alternatives for Restaurant Groups: 8 Options and the Real Per-Location Cost

There are eight credible alternatives to Olo for a restaurant brand that wants out of enterprise online ordering: Toast, ChowNow, Owner.com, Slice, SpotOn, RestauNax, Zay-OS and Lunchbox. The ninth option is the one no ordering platform will put on its comparison page, because it removes the platform from the deal: commissioning the ordering and operations software your brand actually runs on and owning it outright, one fixed fee, no per location licence, no order allotment, no overage rate. Here is the finding that reframes the whole exercise, and we have not seen it anywhere else on this question. Olo publishes no price; we requested olo.com/pricing on August 30, 2026 and got a 404, and olo.com itself loaded normally with no price, plan or fee anywhere on it. But Olo was a public company until September 2025, and in its own Form 10-K filed with the Securities and Exchange Commission it disclosed average revenue per active location of $3,387 for 2024, up from $2,702 in 2023 and $2,189 in 2022. That is $282.25 per location per month, on average, across roughly 86,000 locations. Every third party estimate circulating for Olo, $400 to $600 per location per month, $1,850 per location per month, $3,000 to $8,000 or more monthly, sits above the figure Olo itself filed, and every one of those estimates was published by a company selling a competing product. Which means the useful question is not whether Olo is expensive in the abstract. It is whether your quote is a multiple of the average, and if it is, whether $45,000 to $180,000 of software you own beats renting for another five years. On the numbers below, for a four location chain at the top of the reported range, the two lines cross at month 26.

A note on product names, because operators use them interchangeably and it matters when you read your invoice. Olo is not one product. Its Order suite alone lists nine separately named modules on Olo's own site: Ordering, Serve, Dispatch, Rails, Catering Plus, Olo Loyalty, Order with Google, Switchboard and Olo Network. Pay and Engage are two further suites. An operator asking what Olo costs, or what it would take to leave, is almost always asking about a bundle of several of those, not about one line item, and this page is written for that decision.

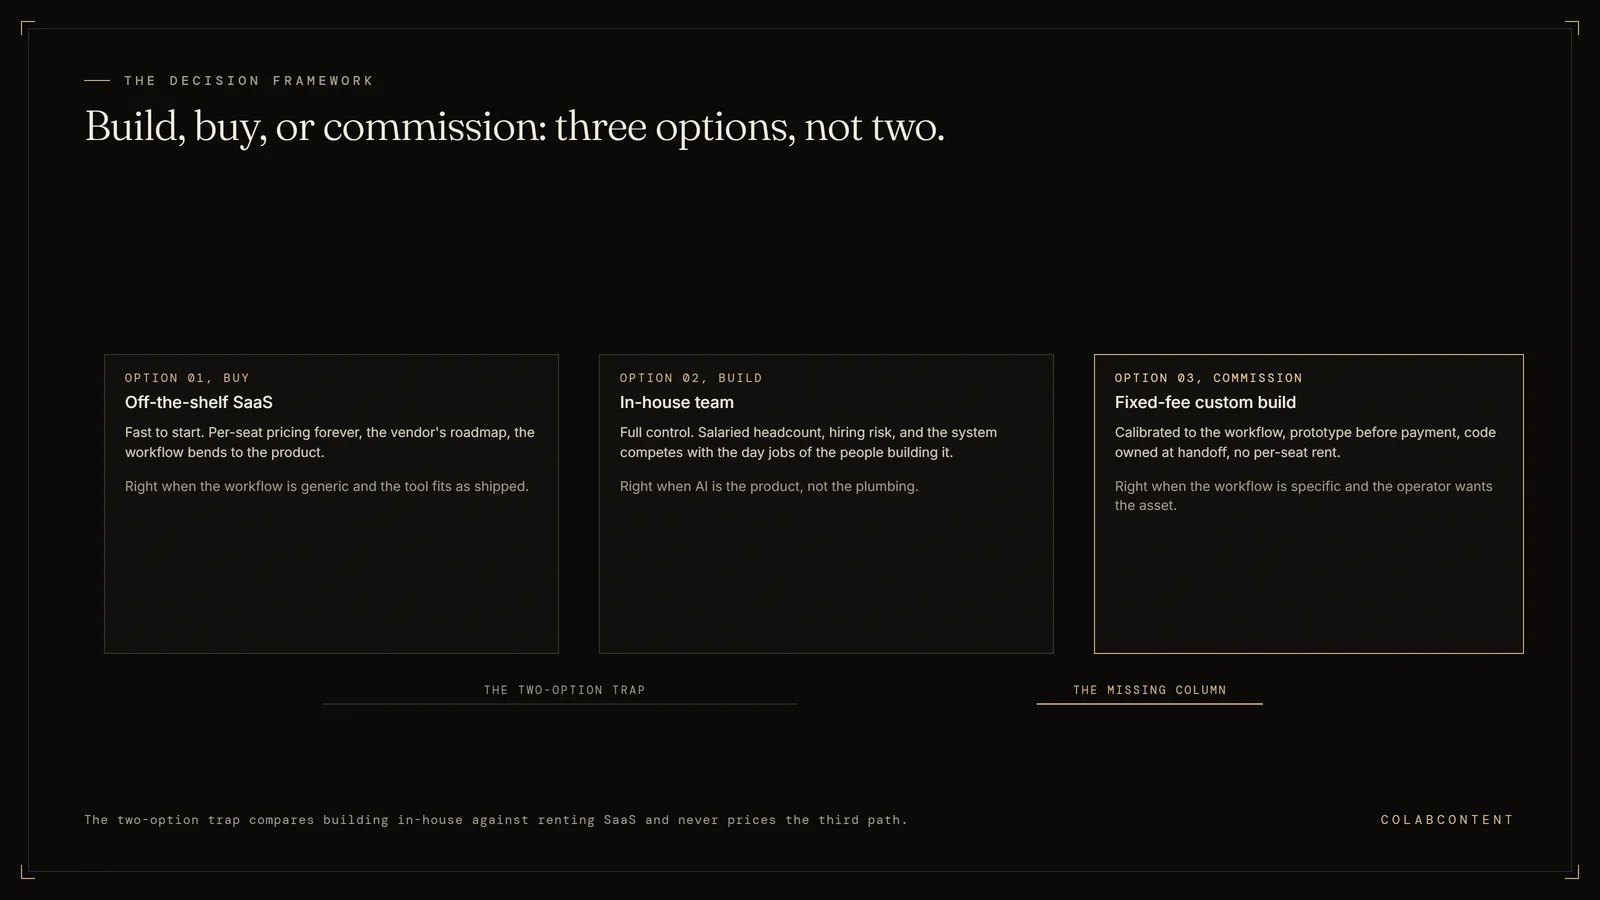
Three options, not two: buy an off the shelf ordering platform priced per location forever, build with an in house engineering team and carry the hiring risk, or commission a fixed fee custom build calibrated to the brand's own ordering and operations workflow and owned by the brand at handoff
Three paths, not two. Platform comparison pages only ever show you the first one.

Written for the multi-unit operator, franchisor or brand technology lead who already pays Olo. We do not sell an ordering platform, we take no referral fee from anyone in the table below, and there is a whole section further down arguing that a lot of brands should stay exactly where they are.

ForRestaurant brands, roughly 3 to 250 locations
Olo costNo published price. $3,387 per location per year filed with the SEC for 2024
Our fixed fee$45,000 to $180,000, one time
StanceNeutral. We sell no ordering platform.
Bottom lineCrossover at month 26 at a $45K build, four locations, $600 per location per month
CostFree 45-minute diagnosis
Last updatedAugust 30, 2026, vendor pages and SEC filings read the same day

The short answer.

If you came here because the renewal number felt wrong, the first thing to understand is that the reason it felt wrong is structural. Olo does not publish a rate card, and neither do Toast or Lunchbox, so the ordinary move of shopping two rivals to build leverage produces almost nothing in this category. Four of the alternatives below do publish real numbers on their own sites, and every one of those four sells primarily to independents and small groups rather than to brands at Olo's scale. That is not an accident. Published pricing and enterprise sales are close to mutually exclusive, and the whole category is built that way.

So the leverage has to come from somewhere else, and there is exactly one place it can come from. Olo filed audited annual reports with the Securities and Exchange Commission until it went private in September 2025, and those filings disclose average revenue per active location. In 2024 that was $3,387 a location for the year. It is an average across roughly 86,000 locations, it includes payment processing and marketplace fees rather than being a pure software rate, and it is emphatically not a quote for anyone. It is still the only number in this category that came from the vendor's own books rather than a competitor's marketing page, and it gives you a benchmark that literally nobody else on this question has put in front of you. Take it into the room. Then run your own five year total against a build, which the calculator on this page will do on your real invoice rather than on our defaults.

What Olo actually does well.

Any alternatives page that opens by explaining why the incumbent is terrible is an advertisement, and you already know that, which is why you scrolled past three of them to get here. Olo is genuinely good at a specific and hard thing, and if that thing is what you need, most of the cheaper names below cannot do it at all.

What it is good at is scale and openness at the same time. Olo's own about page states that it works with over 800 brands reaching 108 million connected guests across approximately 90,000 locations, processing more than 3.5 million orders per day on average, with integrations to over 450 technology partners. Its 2024 annual report puts gross merchandise volume, the gross value of orders processed through the platform, at approximately $29 billion for the year. Those are not marketing adjectives, they are disclosed operating figures, and they describe an ordering layer that has already survived Super Bowl Sunday at national scale for brands whose entire off-premise business runs through it.

The openness matters as much as the scale. Olo's model is to sit between a brand's digital properties and everything else, so the point of sale, the delivery marketplaces, the loyalty vendor, the data warehouse and the payments stack are all pluggable rather than owned by the ordering vendor. That is the opposite of the all-in-one point of sale model, where the ordering module is good because the vendor also owns your hardware and your card processing. If your brand has deliberately chosen best of breed across the stack, Olo is the piece that makes that choice viable, and swapping it for a point of sale vendor's bundled ordering module is not a like for like substitution, it is a strategy change.

The third thing is the marketplace layer, which is less visible and more valuable than it looks on a feature grid. Rails synchronises menus, prices, location data and item availability between your systems and third party sites through a single integration. The alternative is what most operators had before: a tablet per marketplace on the pass, staff rekeying orders into the point of sale, and menu prices that drift out of date on three platforms because nobody had time. Any comparison that treats that as a checkbox has never worked a Friday night with four tablets going.

Why brands start looking for a way out.

Four reasons come up, and they are not all price.

The bill grows without you renegotiating it. This is the one operators feel first and can rarely evidence, so here is the evidence. Olo's own filings show average revenue per active location rising from $2,189 in 2022 to $2,702 in 2023 to $3,387 in 2024. That is roughly 23 percent and then roughly 25 percent year on year. Olo also reported dollar-based net revenue retention of approximately 115 percent for the three months ended December 31, 2024, and 114 percent for the quarter ended June 30, 2025. Net revenue retention above 100 percent means the same set of customers spent more this year than last year. It blends genuine price movement with added modules, added locations and transaction volume, so it is not a published escalator and we will not pretend it is one. It is still the vendor's own filed evidence that the direction of travel on an existing account is upward, and that is the thing operators sense and cannot prove.

You cannot check the number. With no rate card, no plan names and no public benchmark, every buyer in the category is negotiating blind against a salesperson who is not. That is uncomfortable at any price, and it is corrosive at renewal, because the honest answer to is this a good deal has always been nobody outside the room can tell you.

The cost structure has a second half. Olo's 10-K states plainly that a portion of its customers purchase an allotment of monthly orders for a fixed monthly fee and pay an additional fee for each excess order. If your digital business is growing, an allotment model means the fastest growing part of your business is also the part with an uncapped variable cost attached, and operators frequently discover the shape of that only after a strong quarter.

Fit below enterprise scale. A competing vendor writing about this exact question states that enterprise pricing does not justify unit economics below $2M annual digital ordering volume per location, that integration gaps with non-standard POS systems require expensive middleware, and that onboarding timelines of 3 to 6 months are incompatible with a fast operational pivot. Those are a competitor's own directional claims about a rival, published by a company selling an automation layer of its own, and we are labelling them as exactly that rather than laundering them into neutral analysis. We include them because the first one names the real threshold question better than anything Olo or we would write, and because the other two match what operators describe on the way out.

What you are actually paying

Every number on this page, with its source.

Labels on this page are used in one fixed way, and we are copying the definition rather than paraphrasing it, because a paraphrase is how this word drifts. VERIFIED means read off the VENDOR's own page, or verified-by-absence at the vendor's own URL. A figure published by a third-party aggregator (Vendr, PriceLevel, SelectHub, ITQlick, G2, Capterra, checkthat.ai, any buyer-data or review platform) is REPORTED, however good that aggregator's data is. A competing vendor's blog is REPORTED too, however specific its numbers look. ASSUMPTION means it is a modelling input of ours rather than anyone's published figure. DERIVED means we did arithmetic on VERIFIED inputs and we show the arithmetic. Where a source we tried to read refused us, the page says the fetch failed and what we have instead, because a 403 is a failure to observe and never an observation of absence.

First, the absence, checked rather than assumed

Olo publishes no price. On August 30, 2026 we requested olo.com/pricing and the server returned HTTP 404 Not Found, so there is no pricing page at that path to read. We then loaded olo.com itself, which returned normally with its full marketing content, and there is no price, no plan name and no dollar figure anywhere on it. The primary navigation reads Why Olo, Products, Integrations, Restaurants, Resources, About, Customers. There is no Pricing item. The two calls to action are Request a Demo and Contact Us. We ran the same check against olo.com/why-olo, olo.com/solutions/order and olo.com/rails. All three loaded. None of them names a price. That is verified by absence at pages that actually loaded, and a competing vendor that ran the same check independently in July 2026 published the same finding.

Then, the number Olo did publish, and almost nobody has quoted

Olo Inc. traded on the New York Stock Exchange until September 2025, which means that for years it filed audited annual and quarterly reports, and those filings contain a disclosure that the comparison guides written about this decision appear to have missed entirely. Olo reports a key performance indicator it calls average revenue per unit, and it defines the calculation in its own words: we calculate ARPU by dividing the total platform revenue in a given period by the average active locations in that same period.

Olo fiscal yearAverage revenue per active locationPer location per monthYear on yearEnding active locationsSource and label
2022$2,189$182.42Baseline87,000VERIFIED Olo Inc. Form 10-K for fiscal 2023, the vendor's own filing, read directly at sec.gov on August 30, 2026. Olo's own site at olo.com publishes no price at all.
2023$2,702$225.17Up about 23 percent80,000VERIFIED Olo Inc. Form 10-K for fiscal 2023 and fiscal 2024, the vendor's own filings, read directly at sec.gov on August 30, 2026, cross-checked against olo.com, which publishes no figure.
2024$3,387$282.25Up about 25 percent86,000VERIFIED Olo Inc. Form 10-K for fiscal 2024, the vendor's own filing, read directly at sec.gov on August 30, 2026. olo.com itself loaded the same day and publishes no price.
Q2 2025, the last quarter reported$955 for the quarter, about $3,820 annualised$318.33Up 12 percent year on year89,000VERIFIED Olo Inc. Form 8-K earnings exhibit for the quarter ended June 30, 2025, the vendor's own filing, read directly at sec.gov on August 30, 2026. Cross-checked against olo.com, which publishes no figure.

The monthly column is DERIVED and the arithmetic is one step: $3,387 divided by 12 is $282.25. The year on year column is the same kind of step: $2,702 divided by $2,189 is 1.234, and $3,387 divided by $2,702 is 1.254.

What that number is, and four things it is not

This figure is the most useful thing on this page and it is also the easiest thing on this page to misuse, so we are going to spend a paragraph on each limit before anyone carries it into a meeting.

It is an average, and the average is dominated by very large brands. Olo segments its own customers in its 10-K: Enterprise means customers with 100 or more locations, Emerging Enterprise means customers with 5 to 99 locations with growth aspirations. Roughly 86,000 locations sat behind that 2024 average, and its 2023 filing notes that the ten largest restaurant customers generated approximately 12 percent of revenue, with one single customer at 12 percent. A four location group is not being quoted the average and should not expect to be. If your quote is above $282 a location, that alone proves nothing.

It is not a software rate, it is total platform revenue. Olo's 10-K states that for 2024, 45.5 percent of platform revenue was subscription revenue and 54.5 percent was transaction revenue, against 44.7 and 55.3 in 2023 and 50.9 and 49.1 in 2022. Apply the 2024 split and the subscription portion of the average is about $1,541 a location a year, or DERIVED $128.42 a location a month, with the rest coming from transactions. So the pure software half of the average is under half of $282.

Some of that money is not paid by the restaurant. Olo's own description of transaction revenue is that it primarily includes revenue generated from Olo Pay, as well as fees charged to aggregators, channel partners and other service providers in its ecosystem on a per transaction basis for access to the Rails and Dispatch modules. Fees charged to a delivery marketplace for access to Rails are revenue per location to Olo and are not a line on your invoice. Olo Pay is card processing, which replaces a payment processor you were already paying rather than adding a new software cost.

It has a date on it and the clock is running. Thoma Bravo completed its acquisition of Olo on September 12, 2025, per Olo's own announcement, in an all-cash transaction valuing the company at approximately $2.0 billion in equity value at $10.25 per share, after which the common stock ceased trading and was delisted from the New York Stock Exchange. There will be no more quarterly filings. The 2024 figure is the last full year on the public record and it will only get older. That is a reason to use it now.

With all four of those limits stated, the figure still does something no other number in this category does. It tells you what the platform actually earns per location on average, from the platform's own audited books, and it lets you ask the only question that matters in a renewal meeting: our locations are being asked for a multiple of your disclosed average, so what is it about our locations that costs you that much more.

The third party estimates, and why they disagree by eight times

Three competing vendors publish estimates of what Olo costs. They disagree with each other by a factor of eight, and every one of them is above the figure Olo filed. We are printing all three, labelled, with who published them and what that publisher sells, because the spread is itself the finding.

Estimate for OloPublished byWhat that publisher sellsLabel and note
$400 to $600 per location per month for the full suiteustechautomations.comA post-transaction automation layer starting at $96 a month that integrates with Olo, Toast and SquareREPORTED Read directly on ustechautomations.com on August 30, 2026, quoted verbatim as "at $400-$600 per location per month for its full suite". A competing vendor's estimate about a rival, not a neutral finding, and not confirmed by Olo.
$1,850 per location per month, in a named worked exampleustechautomations.comSame vendor as aboveREPORTED Same page, same date. Described as a four location regional burger chain in Dallas paying Olo $1,850 per month per location, $7,400 per month in total. Note that this is roughly three times the same article's own $400 to $600 range, in the same article.
$3,000 to $8,000 or more monthly, $36,000 to $96,000 or more annuallyrestaunax.comRestauNax, whose own published price is $99 a month; the page footer states "We build RestauNax"REPORTED A direct competitor's estimate of the incumbent it is selling against, disclosed as such by the publisher itself.
Starting around $1,000 per month, plus a deployment fee given as $3,000revolutionordering.comRevolution Ordering, a competing online ordering platform sold on flat monthly ratesREPORTED Read on revolutionordering.com on August 30, 2026, which states that "the monthly cost may start at $1,000 per month until you onboard a certain number of units" and refers to a "deployment fee of $3,000 per month". That second phrase is ambiguous as published, so we treat the deployment figure as a one-time $3,000 and we do not model either number anywhere on this page.
$3,387 per location per year, or $282.25 per location per month, for 2024Olo Inc.OloVERIFIED Olo's own Form 10-K filed with the SEC, read directly at sec.gov on August 30, 2026; olo.com itself publishes no price.

Read the table as a whole and the shape is unmistakable. Every estimate produced by a company that would like you to leave Olo is higher, in one case by more than eleven times, than the figure Olo reported to its own regulator. We are not saying those estimates are dishonest. A loaded multi-module deployment for a large brand genuinely can cost multiples of the blended average, and a company writing about the customers who called it will see the expensive end of the distribution. We are saying that a number produced by someone who benefits from it being large deserves a label, and that when the vendor's own audited disclosure is available it wins.

The comparison nobody has run: published alternative prices against Olo's own filed average

Here is what happens when you put the published prices of the alternatives next to the figure Olo actually filed, per location, per month. Every alternative price below was read off that vendor's own pricing page on August 30, 2026 except where labelled otherwise.

Platform and planPublished price per location per monthVariable fees on topAgainst Olo's filed average of $282.25Source and label
Olo, blended average across the base, 2024$282.25 all in, of which about $128.42 is subscriptionOrder allotment with a fee for each excess order, per Olo's own 10-KThe benchmarkVERIFIED Olo Form 10-K fiscal 2024 at sec.gov; olo.com publishes no price.
RestauNax, base platform$99None published. "No commission fees. No long-term contracts."BelowVERIFIED restaunax.com/pricing, loaded August 30, 2026, quoted verbatim.
SpotOn, All-In plan plus Core Bundle$0 per station plus $50 for the Core BundleCard present 2.79 percent plus $0.20; Core Bundle adds 20 basis points of card volume capped at $200 a month; two year minimum termBelow, at $50 to $250VERIFIED spoton.com/pricing, loaded August 30, 2026, quoted verbatim.
SpotOn, POS Essentials plus Core Bundle$55 per station plus $50 for the Core BundleCard present 2.45 percent plus $0.15, Amex 3.19 percent plus $0.15; Core Bundle adds 20 basis points capped at $200; month to monthStraddles it, at $105 to $305VERIFIED spoton.com/pricing, loaded August 30, 2026, quoted verbatim.
ChowNow Launch, annual billing$229 ($249 month to month)2.95 percent plus $0.29 per transaction; setup fee $119 to $499; $99 annual Apple developer fee on branded apps; $7.98 per order on Flex DeliveryAbove once any real volume runs through itVERIFIED get.chownow.com/pricing, loaded August 30, 2026, quoted verbatim.
ChowNow Elevate, annual billing$409 ($449 month to month)Same 2.95 percent plus $0.29 and the same setup fee bandAbove on the base fee aloneVERIFIED get.chownow.com/pricing, loaded August 30, 2026, quoted verbatim.
Owner.com, Flexible$2495 percent restaurant fee per orderAbove once any real volume runs through itVERIFIED owner.com/pricing, loaded August 30, 2026, quoted verbatim.
Owner.com, Flat Rate$499No additional restaurant fees. Positioned as best for restaurants at $5k or more a month in online sales. "Special rates available for multi-location."Above on the base fee aloneVERIFIED owner.com/pricing, loaded August 30, 2026, quoted verbatim.
Slice, Online Membership$39$3.00 per order, none under $10; card processing 2.90 percent plus $0.30Below until about 81 orders a month, above afterVERIFIED slice.com/pricing, loaded August 30, 2026, quoted verbatim.
Slice, Family Membership$399$2.00 per order plus a $1,000 one-time implementation fee; card processing 2.90 percent plus $0.30Above on the base fee aloneVERIFIED slice.com/pricing, loaded August 30, 2026, quoted verbatim.
Zay-OS, Operator through Concierge$399, $499 or $599 by tier, per locationDiner-side fees of $0.99 pickup, $0.99 delivery, $0 dine-in, 10 percent catering, all paid by the diner. No commission charged to the restaurantAboveVERIFIED zay-os.com, loaded August 30, 2026, full dollar list extracted verbatim.
Toast, point of sale base plus digital ordering$0 to about $69 base plus about $75 for digital orderingPayment processing, hardware and per location costs, none of which we could readWould be below, if the figures were confirmableREPORTED pos.toasttab.com/pricing loaded on August 30, 2026, returning HTTP 200, but serves no plan figures; the rate card is assembled in the browser. pos.toasttab.com/restaurant-pos-pricing returns HTTP 404. Figures via review and comparison sites only, so they cannot carry a verified label.
LunchboxReported as starting at $300, custom beyond thatNot publishedAbove, if the reported figure holdsREPORTED Via app directory and press summaries. lunchbox.io/pricing returned HTTP 404 on August 30, 2026; lunchbox.io itself loaded the same day with no price and no pricing link in its navigation, so the absence on the homepage is observed and the $300 figure is not.
ColabContent commissioned build$45,000 to $180,000, one time, scoped per engagementMaintenance modelled at 17.5 percent of build price a yearNot a monthly fee at allOur own published pricing. The maintenance rate is an ASSUMPTION, not a standing contract term.

Now sit with what that table says, because it is the opposite of what this whole corner of the internet says. On published rate cards, most of the named alternatives to Olo cost more per location per month than the average location on Olo generated for Olo in 2024. ChowNow's cheapest annual tier is $229 before a single transaction fee. Owner.com's flat plan is $499. Slice's Family Membership is $399. Zay-OS starts at $399. Only RestauNax at $99, SpotOn's bundle at $50 to $250, and the unconfirmable Toast figures land below $282.25.

The honest reading has three parts and you need all three. First, this does not mean Olo is cheap for you; averages hide enormous variance and the alternatives' list prices are aimed at independents who would never be quoted Olo's average in the first place. Second, it does mean that switch and save is frequently false as stated, and that anyone selling you a cheaper platform on a rate card comparison is comparing an independent's list price against an enterprise buyer's negotiated bundle without saying so. Third, and this is where the page turns, it means the interesting question was never which subscription is cheapest. Every option in the table is rent. The only line in it that ever stops is the last one.

The order allotment, which is the part to nail down in writing

One sentence in Olo's own 10-K is worth more to you in a negotiation than any comparison table: a portion of our customers purchase an allotment of monthly orders for a fixed monthly fee and pay us an additional fee for each excess order. Olo treats that excess-order money as subscription revenue in its accounts, which tells you it is a routine part of the model rather than an edge case.

What that means practically is that a monthly platform figure quoted to you may be a floor rather than a price. If your digital mix is growing, and for most brands it is, the growth arrives with an uncapped variable attached. The two questions that resolve it are short enough to ask on a call: what monthly order allotment am I buying per location, and what is the exact per order rate above it. Then ask for both in the order form rather than in an email. An allotment you cannot see is the single most common reason an operator tells us their platform bill went up when nothing changed.

Four numbers we deliberately did not print

The omissions are part of the finding, so here they are by name.

The comparison we were handed and could not stand up. A worked comparison circulates for this question describing a three location chain at roughly 900 online orders a day paying about $1,800 a month on Toast against about $4,500 a month on Olo, attributed to a named competing vendor. We went to verify it before using it, fetched all six Olo-relevant pages on that vendor's domain, and ran targeted phrase searches against the same domain. It is not there. Neither the scenario nor the numbers nor the attribution survived checking, so it does not appear on this page in any form. The real worked example on a different vendor's domain, the Dallas four location chain, is in the table above with its correct attribution.

Toast's actual price. We tried twice, at two different URLs. pos.toasttab.com/pricing loaded and returned HTTP 200, but the page it serves contains no plan figures; pos.toasttab.com/restaurant-pos-pricing returns HTTP 404. The competing vendor whose article we cite elsewhere on this page reports that Toast's pricing page refused two independent checks in its own research. Neither of us ended up with a Toast plan rate read off a Toast page. The circulating figures appear in the table labelled REPORTED, and we are not treating them as observed, because we did not observe them.

Square. Square is a real alternative for independents and it does publish, but our read of squareup.com's restaurant pricing page on August 30, 2026, which loaded normally, returned the plan structure without the monthly figures rendering: a free tier with a branded online ordering page, then Plus, Premium and a custom-quoted Pro tier. We can tell you from the vendor's own page that a genuinely free tier with online ordering exists. We cannot tell you what Plus costs, because we did not read it, so we print no figure and Square gets no row rather than a wrong one.

An Olo escalation rate. There is no published Olo price-increase term anywhere, from Olo or from anyone else. What exists is Olo's own filed net revenue retention, approximately 115 percent for the quarter ended December 31, 2024 and 114 percent for the quarter ended June 30, 2025. We looked specifically for a documented Olo price-increase percentage on the three competing-vendor domains cited above and on olo.com, and found none. Net revenue retention is not an escalator; it blends price with modules, locations and volume. So the model below runs at zero escalation by default, which is the choice that makes our own case weaker rather than stronger, and the calculator lets you set your own rate if your contract has one.

The five year model, and the four different answers it gives

Because Olo's cost has four defensible anchors rather than one, collapsing them into a single headline would be dishonest. So here is the same model run against all four, for the same four location chain, against the same $45,000 build at the floor of our range with maintenance at 17.5 percent a year as a stated ASSUMPTION. Zero escalation on the incumbent side throughout. Annual maintenance is $7,875.

Olo cost anchor usedLabelAnnual spend, 4 locationsCrossover against a $45,000 buildCumulative at year 5Five year difference
$282.25 per location per month, Olo's own filed 2024 averageVERIFIED Olo's own SEC filing at sec.gov; olo.com publishes no price$13,548About 7 years 11 months. Does not pay back inside five years.$67,740 rented against $84,375 owned$16,635 in favour of staying on Olo
$400 per location per month, bottom of the reported full-suite rangeREPORTED ustechautomations.com, a competing vendor$19,200About 4 years$96,000 rented against $84,375 owned$11,625 in favour of the build
$600 per location per month, top of the reported full-suite rangeREPORTED ustechautomations.com, a competing vendor$28,800Month 26$144,000 rented against $84,375 owned$59,625 in favour of the build
$1,850 per location per month, the reported worked exampleREPORTED ustechautomations.com, a competing vendor$88,800About month 7$444,000 rented against $84,375 owned$359,625 in favour of the build

We are going to say the uncomfortable line out loud rather than bury it, because a page that only ever concludes in its own favour is not worth reading. On the single best-sourced number available, the one Olo filed itself, a four location chain paying the platform average does not break even on a $45,000 build for nearly eight years, and is $16,635 better off renting at the five year mark. If that is your situation, close this page and renew. The ownership case does not need every reader; it needs the readers whose invoices are actually a multiple of the average, and a great many of them are, which is why the top row of that table is not the row most people arrive here from.

The rule of thumb that makes this portable

You do not need our calculator to know roughly where you sit, and the arithmetic is small enough to do in a meeting. At maintenance of 17.5 percent a year, a build pays for itself in two years when your annual incumbent spend is about 68 percent of the build price, and in five years at about 38 percent of it. That falls straight out of the formula: the build costs B up front plus 0.175B a year, so over N years it costs B plus 0.175BN against your incumbent spend of I times N, and setting those equal gives I equals B times (1 plus 0.175N) divided by N.

Build priceAnnual maintenance at 17.5 percentAnnual incumbent spend needed for a 2 year paybackSame, per monthAnnual incumbent spend needed for a 5 year paybackSame, per month
$45,000, floor of our range$7,875$30,375$2,531$16,875$1,406
$112,500, midpoint$19,688$75,938$6,328$42,188$3,516
$180,000, ceiling of our range$31,500$121,500$10,125$67,500$5,625

Two things fall out of that table and both of them cut against us, which is exactly why they are on the page. First, at the ceiling of our range, $180,000, the maintenance alone is $31,500 a year, which is more than a four location chain at $600 a location a month even pays Olo. A build at that size never pays back for a brand that small, at any horizon, and we would tell you that on the call rather than let you find it in year three. Second, the whole ownership case is a function of total incumbent spend, not of how annoyed you are with your vendor. Multiply your per location figure by your locations by twelve, compare it to those two columns, and you have your answer before you speak to anyone, us included.

The crossover

Where the two lines meet.

Cumulative spend for a four location chain, five years out, on the middle case. Olo at $600 per location per month, the top of the full-suite range REPORTED by ustechautomations.com, held flat with no escalation at all, which is deliberately the choice that weakens our own conclusion. Against it, a commissioned build at $45,000, the floor of our $45,000 to $180,000 range rather than a quote for anyone, paid once at the start, with maintenance at 17.5 percent of the build price a year as a stated ASSUMPTION, which is $7,875 a year. Every figure in the chart comes from the tables above and carries its label with it. The two cases that bracket this one, Olo's own filed average of $282.25 and the reported worked example of $1,850, are not plotted because at this scale one of them never crosses inside the chart and the other crosses before the axis gets going; both are in the four anchor table above with their own crossover points.

Cumulative five year cost: Olo subscription versus a one time commissioned build, four locations Cumulative cost chart, from day one through year five, for a four location restaurant chain. Olo spend at the reported $600 per location per month, held flat with no escalation, starts at zero and rises in a straight line to $28,800 after year 1, $57,600 after year 2, $86,400 after year 3, $115,200 after year 4 and $144,000 by year 5. A one time ColabContent build at $45,000 plus 17.5 percent annual maintenance starts much higher at $45,000 on day one and rises slowly to $52,875, $60,750, $68,625, $76,500 and $84,375 by year 5. The build line is above the Olo line for the first two years, so staying on the subscription is genuinely the cheaper decision at first. The two lines cross at about month 26, early in year 3, at roughly $61,900 of cumulative spend on each path, after which the Olo line stays above the build line for the rest of the chart. By year 5 the gap is $59,625 in favour of the build. On Olo's own filed average of $282.25 per location per month the lines would not cross for about seven years and eleven months. $0 $40K $80K $120K $160K Day one Year 1 Year 2 Year 3 Year 4 Year 5 Crossover, month 26 about $61,900 each Olo $144,000 Owned build $84,375 Olo, 4 locations at $600 per location per month REPORTED, zero escalation Commissioned build, $45,000 once, 17.5% maintenance ASSUMPTION

Look at the first two years before anything else, because that is the part a vendor chart usually hides by starting the axis somewhere flattering. The build line starts at $45,000 on day one while the subscription starts at nothing, and it stays above for the whole of years one and two. At the twenty four month mark the subscription has cost $57,600 and the build has cost $60,750, so staying on Olo is genuinely the cheaper decision for slightly over two years. That is not a concession we are making reluctantly; it is the actual shape of the trade, and any operator who needs the money to work inside twenty four months should stop reading here and renew.

The lines cross at about month 26, at roughly $61,900 of cumulative spend on each path. After that the gap widens every year, because one line has a slope and the other is nearly flat. By the end of year three the difference is $17,775 in your favour. By year five it is $59,625, and nothing in the model bends the subscription line back down, because nothing in a real contract does either. Note that we did not help this along: the Olo line here is drawn with zero annual increase, even though the vendor's own filings show net revenue retention of 114 to 115 percent and average revenue per location climbing 23 percent and then 25 percent in consecutive years. Turn escalation on in the calculator and the crossover moves earlier. We left it off in the chart on purpose.

Change the inputs and the conclusion changes, which is the honest limit of the argument and the reason the calculator exists. At Olo's own filed average of $282.25 a location, the same four location chain does not cross for about seven years and eleven months, and is better off renting at every horizon this chart covers. At $1,850 a location, the reported worked example, it crosses at about month seven. At the midpoint of our fee range, $112,500, against $600 a location and four locations, it does not cross inside ten years at all. Add locations and it moves the other way fast, because the subscription is charged per location and the build is not. Twelve locations at $600 each is $86,400 a year, and against a $112,500 build that crosses at about month twenty. The variable that decides this is your total annual platform spend, and the calculator below runs it on yours.

Your brand, your numbers

The Olo total cost calculator.

Every default below is a figure from the tables above, and every one of them is editable, because the defaults are third party estimates and your invoice is a fact. Nothing is submitted anywhere. There is no email gate, the tool makes no external request, and it stores no value. The arithmetic runs in your browser and stops there. If your inputs make the build lose, the tool says so in plain words rather than quietly hiding the result, and on Olo's own filed average for a small chain it will say so.

Olo prices per location under a brand master agreement, so this is the input that drives the whole subscription. A commissioned build is not priced per location.
Default $600, the top of the $400 to $600 full-suite range REPORTED by ustechautomations.com. Olo's own filed 2024 average was $282.25. A reported worked example puts one chain at $1,850. Olo publishes nothing. Use your invoice.
Default 0, deliberately. Olo publishes no escalation term. Its own filed net revenue retention was 114 to 115 percent and average revenue per location rose 23 then 25 percent, but those blend price with modules, locations and volume. Set your own if your contract states one.
Used only for the percentage-fee comparison below. Default 200. A reported worked example claims 800 per location per day for a four location chain, which we think is high enough to flag.
Used only for the percentage-fee comparison. Default $30.
ColabContent fixed fee range, $45,000 to $180,000, set after the diagnosis call. The chart above uses the floor.
Stated ASSUMPTION at 17.5 percent, the midpoint of a 15 to 20 percent range. Not a ColabContent contract term and not anyone's published figure. Replace it with a real quote before deciding.
The headline total is calculated over this horizon. The three and five year rows below are fixed.
The roundup

Eight alternatives, plus the option nobody sells you.

These are ordered roughly by how often they turn up on a real shortlist against Olo, not by preference. We sell none of them and take no fee from any of them. Where a vendor publishes a price on its own page we quote it and say so. Where it does not, we say that instead of filling the gap with an estimate.

1. Toast, digital ordering inside the point of sale

What it is. A restaurant point of sale platform with online ordering, delivery, loyalty and payments built as modules on top of its own hardware and card processing. It is the name that comes up first in almost every Olo conversation, because it is the most visible restaurant technology brand in North America and because its ordering module is bundled rather than bought separately.

Published price. Toast publishes a plan rate, but only to a browser. pos.toasttab.com/pricing loaded on August 30, 2026 returning HTTP 200, and the served document describes Toast pricing as starting at $0 a month and directs you to request a custom quote. Re-read in a browser on August 31, 2026, the same page publishes a $0 Starter Kit and a Point of Sale plan starting at $69 a month, because the rate card is assembled in the browser rather than written into the page. pos.toasttab.com/restaurant-pos-pricing returns HTTP 404. A competing vendor writing about this same comparison states that Toast's pricing page refused two independent checks in its own research. What circulates on review and comparison sites, which we are labelling REPORTED and not standing behind, is a point of sale base of $0 to about $69 a month with a digital ordering module around $75 a month, before processing, hardware and per location costs.

Best for. Brands willing to standardise on Toast hardware and Toast payments, where bundling ordering with the point of sale removes an integration rather than adding one.

Where it falls short. The ordering-only cost is genuinely hard to isolate, because the economics live in payment processing and hardware rather than in the module fee. And moving from Olo to Toast is not a swap of one ordering vendor for another; it is a decision to let your point of sale vendor own the customer-facing layer too, which is the exact opposite of the open, best-of-breed architecture most brands chose Olo for in the first place.

Verdict. The most credible enterprise-adjacent alternative on this list, and the one whose real cost you will have to extract from a salesperson rather than a web page.

2. ChowNow

What it is. Commission-free branded online ordering, a branded mobile app, and a marketplace listing, aimed squarely at independents and small multi-unit brands. It has been the standard answer to "I want my own ordering rather than DoorDash's" for a decade.

Published price. VERIFIED on get.chownow.com/pricing, loaded August 30, 2026: Launch at $229 a month on annual billing or $249 month to month, Grow at $319 or $349, Elevate at $409 or $449. Setup fee of $119 to $499. Transaction fee of 2.95 percent plus $0.29 on every order. The same page also lists a $99 annual Apple developer fee for branded mobile apps, printers at $250 to $420, and $7.98 per order for Flex Delivery orders.

Best for. Independents and groups under roughly ten locations who want a branded app and a real ordering front end without an enterprise sales process, and who are converting away from marketplace commissions rather than away from an enterprise platform.

Where it falls short. The transaction fee stacks on top of the subscription, which is the thing to model before signing. At 200 orders a day per location and a $30 average order, ChowNow's own published Elevate rate works out to roughly $7,550 per location per month, almost all of it percentage fees. Features are also tiered: QR ordering, third party aggregation and SMS sit behind the higher plans. And it is not built to run a two hundred location brand's off-premise business.

Verdict. Excellent at its own size, and its published pricing is a genuine service to the category. Do the percentage arithmetic at your real volume before you compare it to anything enterprise.

3. Owner.com

What it is. An all-in-one for independents: an AI-assembled website, online ordering, email and text marketing, and a branded app, sold as one subscription rather than as modules.

Published price. VERIFIED on owner.com/pricing, loaded August 30, 2026: a Flexible plan at $249 a month plus a 5 percent restaurant fee per order, described as costs that scale with your sales, and a Flat Rate plan at $499 a month with no additional restaurant fees, positioned as best for restaurants at $5,000 or more a month in online sales. The page also states that special rates are available for multi-location.

Best for. A single location or a very small group that wants the website, the ordering and the marketing to arrive as one decision, with a real published number attached.

Where it falls short. Multi-location pricing reverts to a custom quote, which reintroduces the exact opacity that sent you looking for Olo alternatives. And the 5 percent order fee on the cheaper plan is the same structural problem as any commission model: it grows precisely as the part of your business you are trying to grow grows.

Verdict. The most honest small-operator pricing on this list, and the least relevant to a brand of any real size.

4. Slice

What it is. Ordering, marketing and point of sale built specifically for independent pizzerias, sold explicitly as the commission-free alternative to the delivery marketplaces.

Published price. VERIFIED on slice.com/pricing, loaded August 30, 2026: an Online Membership at $39 a month plus $3.00 per order, with no per-order fee under $10, and a Family Membership at $399 a month plus $2.00 per order and a $1,000 one-time implementation fee. Card processing on both is 2.90 percent plus $0.30.

Best for. Independent pizzerias, and only them. The product is built around the category's actual economics rather than adapted to it.

Where it falls short. It is not a general restaurant platform and does not claim to be. The per-order fee overtakes Olo's blended filed average of $282.25 a location a month at about 81 orders a month on the $39 plan, which is a very low bar, so the cheap headline is only cheap at very low volume. There is no multi-brand or enterprise story here at all.

Verdict. If you are a pizzeria, it belongs on your list. If you are a brand evaluating Olo alternatives, it does not.

5. SpotOn Restaurant

What it is. A full-service restaurant point of sale with ordering, marketing and payments, notable in this category for publishing an actual rate card including processing rates, which almost nobody at its size does.

Published price. VERIFIED on spoton.com/pricing, loaded August 30, 2026: an All-In plan at $0 per station per month with card-present processing at 2.79 percent plus $0.20 and keyed at 3.79 percent plus $0.20, on a two year minimum term with processing minimums; POS Essentials at $55 per station per month with card-present at 2.45 percent plus $0.15, Amex at 3.19 percent plus $0.15, keyed at 3.45 percent plus $0.15, month to month; a Core Bundle add-on covering online ordering and marketing at $50 a month plus 20 basis points of card volume capped at $200 a month; and a Build Your Own tier at custom pricing.

Best for. Full-service restaurants and small groups that want ordering, point of sale and payments from one vendor with the rates in writing before a sales call.

Where it falls short. Enterprise and multi-location still falls to Build Your Own custom pricing, so the transparency stops exactly where your scale starts. The free-station plan carries a two year minimum term and processing minimums, which is the trade being made for the zero. And like Toast, it is a point of sale vendor answer to an ordering-layer question.

Verdict. The most transparent pricing in this entire comparison, and the only bundle on the list whose all-in monthly cost lands below Olo's own filed average.

6. RestauNax

What it is. A flat-rate online ordering platform for independents, sold on the simplicity of one price with no commission and no contract.

Published price. VERIFIED on restaunax.com/pricing, loaded August 30, 2026: $99 a month with the complete core platform included, described as one simple base price with optional premium add-ons, no commission fees and no long-term contracts. Add-on tier pricing did not appear in what we read, so we are not printing any.

Best for. An independent or very small group who wants the lowest published flat monthly rate in this set and does not need enterprise modules.

Where it falls short. Two things, and we would want them said about us. First, the add-on pricing is not published, so the $99 is a floor rather than a total. Second, RestauNax also publishes the Olo alternatives comparison content that estimates Olo at $3,000 to $8,000 or more a month, which is the highest estimate anywhere and roughly eleven times what Olo actually filed. Its own page footer discloses that it builds RestauNax, which is more transparent than most of the category manages, but it means its comparison of the incumbent is a competitor's comparison.

Verdict. A real product at a real published price, and a reminder to read who wrote every comparison you find, including this one.

7. Zay-OS

What it is. A newer multi-location ordering and operations platform that has taken the unusual step of publishing a per-location rate card in a category where nobody at its target size does.

Published price. VERIFIED on zay-os.com, loaded August 30, 2026: Operator at $399 per location per month, Operator plus Tablet at $499, Concierge at $599. Diner-side fees of $0.99 on pickup, $0.99 on delivery, $0 dine-in and 10 percent on catering, all paid by the diner rather than by the restaurant. The 15 to 30 percent base and 25 to 35 percent blended commission figures that also appear on that page are what Zay-OS says the delivery marketplaces charge, which is the cost it positions itself against, not a fee it charges you.

Best for. Mid-size multi-location brands who want to see a number before a sales cycle, and who would rather negotiate down from a published rate than guess at a custom quote.

Where it falls short. It is a younger and much smaller brand than Toast or ChowNow, with correspondingly less at-scale track record. And the published rate is quoted per location with nothing on the page about a multi-location rate, so a group of any size is multiplying $399 to $599 by its location count with no stated volume position to work from.

Verdict. The most interesting pricing posture in the category, and the one most worth a quote if published rates are the thing you actually want.

8. Lunchbox

What it is. An enterprise and mid-market ordering platform that competes with Olo on Olo's own ground rather than offering a smaller alternative: branded ordering, catering, loyalty and marketing for multi-unit brands.

Published price. Not published, and we checked. lunchbox.io/pricing returned HTTP 404 on August 30, 2026, and lunchbox.io itself loaded normally the same day with no price anywhere on it and no Pricing item in its navigation, which reads Products, Resources, Partners, Company, Login. A figure of "starting at $300 a month" circulates through app directories and press summaries; that is REPORTED only, we did not read it on a Lunchbox page, and it should be treated as a starting point for a conversation rather than a rate.

Best for. Multi-brand and multi-unit operators who want a genuine like-for-like replacement at Olo's scale rather than a step down, and who are willing to run an enterprise procurement to get one.

Where it falls short. It has exactly the same opacity problem as the incumbent you are trying to leave. If your complaint about Olo is that you cannot check the price, moving to another platform that also does not publish one solves nothing about that complaint. It may still be the right move for other reasons.

Verdict. The closest thing to a true peer competitor on this list, and the one where the cost conversation starts from zero public information on both sides.

9. A commissioned build you own

What it is. The ordering, operations or guest-data workflow your brand actually runs on, specified around how you work, built once for a fixed fee, and owned by you outright at handoff. Source code, data, infrastructure, all of it. It is not a platform replacement in most cases; it is usually one or two workflows lifted out of a platform you keep, or a layer built alongside it.

Published price. $45,000 to $180,000, one time, scoped per engagement, set after a diagnosis rather than quoted from a page. Maintenance modelled throughout this page at 17.5 percent of the build price a year as a stated ASSUMPTION, which is our modelling input rather than a contract term.

Best for. Brands whose annual platform spend is already a meaningful fraction of the build price, per the two columns in the rule-of-thumb table above, and whose pain is a specific workflow rather than a general dislike of the vendor. That combination is where this wins and it is not everybody.

Where it falls short. It is the slowest option on this list to stand up, it carries execution risk that a subscription does not, and it is genuinely the wrong answer below a spend threshold we have printed in two separate tables so you can check yourself against it before talking to us. It also does not, by itself, replace a full enterprise ordering platform with 450 integrations and 15 marketplace connections. Anyone telling you a fixed fee build replaces all of that in one go is selling.

Verdict. The only option in this comparison whose cost stops, and the only one where the asset ends up on your side of the balance sheet. Also the only one with a floor you have to clear before it makes sense.
The ownership case

Ten arguments for owning it instead.

Each of these has to survive a hostile reader, so each one is concrete or it is not here. Where an argument needs a number, the number is above with its label. Where it does not, we are not going to invent one to make it look researched.

1. The subscription never ends, and the chart already proved it

The crossover above is the whole argument compressed into one image. Four locations at the reported $600 a location a month is $28,800 a year forever, with no escalation modelled at all. A $45,000 build plus $7,875 a year of maintenance overtakes it at month 26 and is $59,625 ahead by year five. Run it to year ten and the subscription has cost $288,000 against $123,750 owned. Nothing in the model makes the rented line bend downward, because nothing in a real master agreement does either. The only variable that matters is whether your annual spend clears the threshold in the rule-of-thumb table, and if it does not, we have said clearly that this argument does not apply to you.

2. Per-location pricing taxes the thing you are trying to do

Olo prices per location. That is not a criticism, it is a business model, and it is a perfectly rational one for a vendor. But look at what it does to you. Every new location you open, every acquisition you close, every conversion you sign, arrives with a permanent monthly fee attached before it sells a single sandwich. Growth is the thing your whole company is organised around, and the platform is the one line item that becomes structurally more expensive the better you do. A build has no per-location licence. Location one hundred and location one cost the same to run: nothing.

3. It is an asset, not an expense

Five years of platform subscriptions produce a stack of paid invoices. Five years after a build, you own software: source code, data model, deployment, the lot. That is transferable, it is diligence-able, and it shows up on the right side of the ledger when a private equity buyer or a franchisor looks at your operation. Restaurant groups get bought on the strength of unit economics and operational infrastructure, and one of those two things is something you can actually own.

4. Built around your workflow, not the other way round

An enterprise platform serves roughly 86,000 locations across quick service, fast casual, casual dining, family dining and coffee. It has to be general, and generality is why it is good, and generality is also why every brand on it has three or four processes bent slightly out of shape to fit the software. The catering flow that does not match how your catering actually works. The modifier logic that nearly handles your build-your-own line. The reporting export somebody rebuilds in a spreadsheet every Monday. A commissioned build starts from your process. You are not paying for the modules you do not run, and you are not paying anyone to be general on your behalf.

5. AI at the core rather than as a per-location add-on

The pattern across every category we work in is the same: platforms sell AI as an additional module, priced per seat or per location, on top of a subscription you already pay. We are not going to attach a number to Olo's AI pricing, because Olo publishes no prices at all and inventing one would break the rule this entire page is built on. What we can say is structural. In a commissioned build, the model calls are yours, the prompts are yours, the data that trains and grounds them is yours, and adding an AI capability costs engineering time once rather than a recurring fee multiplied by your location count forever. We have run 6,000 or more AI-handled calls across client systems built exactly this way; the marginal cost of the next location on those systems is close to nothing.

6. Unlimited locations, staff and franchisees at zero marginal cost

The natural consequence of point five, and worth separating because operators feel it differently. On a per-location platform, rolling a capability out to your seasonal locations, your licensee locations or your test kitchen is a budget conversation. On owned software it is a deployment. That changes which experiments get run, which is a bigger operational difference than it sounds.

7. Your data, your export path, no exit negotiation

Every platform holds your guest data, order history and menu structure inside its own schema, and the terms on which you get it back are whatever your contract says and nothing more. With a build, the database is yours from the first day; there is no export request, no professional services quote to extract your own history, and no leverage held over you at renewal by the fact that leaving is technically painful. This is less dramatic than it sounds right up until the quarter you decide to leave.

8. Vendor risk you no longer carry

This one is factual for Olo specifically and we are going to state it carefully, without a scare story, because there is not one available. Olo was acquired by Thoma Bravo in an all-cash transaction valuing it at approximately $2.0 billion in equity value, at $10.25 per share, completed on September 12, 2025 per Olo's own announcement, after which the stock ceased trading and was delisted from the New York Stock Exchange. Nothing has been announced about products, pricing or support changing, and we make no prediction that anything will. What is simply true is that ownership changed, the public reporting stopped, and the strategy of a platform you depend on is now set by people you have never met and cannot read about in a filing. That is ordinary vendor risk and every restaurant group carries some of it. Owned software is the portion of your stack where you carry none.

9. Change speed

The difference between a change request to your own system and a feature request in a vendor's roadmap queue is not measured in weeks, it is measured in whether it happens at all. A platform serving 86,000 locations prioritises what serves 86,000 locations, correctly. Your regional catering quirk, your loyalty mechanic, your franchisee reporting requirement, these are not going to win that argument, and they should not. On owned software they are a Tuesday.

10. One fixed fee, and proof it is real

$45,000 to $180,000, scoped once, paid once. What makes that credible is not the sentence, it is the finished work. Jim Glaser Law is a nameable client who takes reference calls. The LELF platform is a live system in production. Across our engagements the systems we have built have handled more than 6,000 AI calls, and we have delivered 40 or more commissions. That is the whole proof list, and we hold to it deliberately: no invented case studies, no anonymous logos, no percentage improvements we cannot show you the arithmetic for. If a comparison page shows you a client result you cannot verify, you already know what that is worth.

The honest section

Who should stay on Olo.

This is the part of the page we would want to read first if the roles were reversed, so it is specific rather than decorative. If any of these describes you, the correct action is to renew, negotiate, and not to call us.

You are paying at or near the platform average

This is the big one and the numbers are already on the page. Olo's own filed average revenue per location was $3,387 for 2024, or $282.25 a month. A four location chain at that rate spends $13,548 a year. Against a $45,000 build with maintenance at our 17.5 percent assumption, that does not break even for about seven years and eleven months, and you are $16,635 better off renting at year five. If your invoice divided by your locations divided by twelve lands anywhere near $282, you are getting the platform at close to what it costs on average, and there is no arithmetic on this page that says otherwise.

Your total annual platform spend is under the threshold

Two columns in the rule-of-thumb table above settle this without a phone call. At the floor of our fee range, a build needs about $30,375 a year of incumbent spend to pay back in two years and $16,875 to pay back in five. Below the five year figure it does not pay back inside any horizon a restaurant operator plans on. Multiply and check. If you are under, stop.

You genuinely use the marketplace layer at scale

Rails synchronises menus, prices, location data and availability across marketplaces through a single integration, and Olo's own page claims 15 or more marketplace integrations and 99 percent delivery market coverage. If a meaningful share of your volume arrives through DoorDash, Uber Eats and Grubhub, and your locations are not running tablets because of it, that is a genuinely hard problem being solved for you every day. Rebuilding marketplace integration coverage from scratch is not a $45,000 project and we would not take it on as one.

You deliberately chose best of breed and it is working

Olo's whole architectural argument is that it sits between your digital properties and everything else so that the point of sale, loyalty, payments, delivery and data warehouse stay independently swappable. Olo's own about page describes integrations to over 450 technology partners. If your brand made that choice on purpose and your stack is genuinely modular because of it, replacing the connective layer is the single most disruptive thing you could do to it. That is a strategy change disguised as a cost saving.

You need something running next month

A commissioned build is measured in months, not weeks, and the honest version of that timeline is in the migration section below. If a franchisee rollout, a menu launch or a marketing calendar has a fixed date attached, buy the thing that exists. This is true of any build, from us or anyone else, and any consultancy that tells you otherwise on a first call is telling you what you want to hear.

Your problem is the contract, not the software

A surprising share of the people who search for a way out of a platform actually want a better deal on the platform they have. If the product works and the number is the only complaint, the cheapest fix on this page is free: pull your own numbers, take the filed average into the renewal, ask about the order allotment and the overage rate in writing, and negotiate. You do not need us for that and we would rather you did it.

Decision tree

Six questions, in order, with stop points.

1. What is your actual spend per location per month? Take your last twelve months of platform invoices, divide by locations, divide by twelve. If the answer is at or below about $282, you are at or below the average Olo reported for 2024 across roughly 86,000 locations. Stop here and renew. Nothing else on this page improves on that position, and you now have a fact to hold the line with at your next renewal.

2. Multiply it out. Is your annual platform spend above $16,875? That is the five year payback threshold against the floor of our fee range at our stated maintenance assumption. If no, stop here. No build we would sell you pays back inside five years at that spend, and we would tell you so on the call before you finished describing the problem.

3. Is your annual platform spend above $30,375? That is the two year payback threshold at the same floor. If no, the honest answer is renegotiate first. Go back to question one, use the filed average, ask for the order allotment and overage rate in writing, and see what the number looks like after that conversation. Come back if it does not move.

4. Is your pain a specific workflow, or is it the whole platform? If you can name the two or three processes that leak money, a build alongside what you keep is the cheap, fast, low-risk answer, and it does not require you to migrate anything. If the answer is that you dislike the platform generally but cannot name a workflow, stop. Generalised dissatisfaction is not a specification, and a build with no specification is how projects fail.

5. Does the marketplace layer carry real volume for you? If a serious share of your orders arrive through delivery marketplaces and Rails is the reason your locations do not run four tablets, keep the platform and scope the build around the workflows Rails does not touch. This is by far the most common good answer we give on these calls.

6. Do you have a hard date inside four months? If yes, stop and buy something that exists. If no, and you cleared questions two through five, then a diagnosis is worth 45 minutes: bring your invoice, your location count, your order allotment if you know it, and the two workflows you named in question four.

Next step

Book the 45-minute diagnosis.

Free, under NDA, no obligation. Bring your last platform invoice and your location count. We will run your real numbers against the model on this page, tell you where you sit against Olo's own filed average, and give you a straight answer on renegotiate, switch or build. A meaningful share of these calls end with us telling an operator to stay exactly where they are, which is why the thresholds are printed above rather than kept for the call.

Migration reality

How long does it take to switch away from Olo, and what does it actually involve?

Every comparison page in this category ends at the price table, which is where the hard part starts. Here is what leaving an enterprise ordering platform actually looks like, written without the parts that are conveniently omitted.

The timeline nobody wants to say out loud

A competing vendor writing about this category states that onboarding timelines of 3 to 6 months are incompatible with a fast operational pivot. That is a competitor's own directional claim about enterprise onboarding, REPORTED rather than neutral, and we include it because it is the only published figure we found and because it matches what operators describe. Read it as a floor rather than a ceiling. Whatever the replacement takes to stand up, you should assume a parallel period on top of it, and the practical consequence is that a switch decided in Q1 is a switch that lands in Q3 at the earliest.

What you are actually moving

Not one thing, and this is where scope surprises live. Menus and modifier logic per location, which is almost never as clean in reality as it looks in the console. Location data, hours, holiday calendars and availability rules. Guest accounts and any stored payment credentials, which usually cannot move at all and mean your customers re-register. Order history, which you want for analytics and which nobody plans for. Loyalty balances, which are a liability on your books and which have to reconcile exactly. Every marketplace connection, one at a time. Every point of sale integration, per location, per point of sale version. Any tax and fee configuration. And the parts nobody lists: the pixel and analytics wiring on your ordering flow, the deep links inside your existing app, and every printed and digital QR code in your locations that points at a URL you are about to change.

The parallel run, which is not optional

Run both systems side by side for at least one full business cycle including a weekend peak, with a small set of locations on the new platform first. The test that matters is not whether an order goes through; it is whether the order that goes through arrives at the right kitchen with the right modifiers at the right time under load, and whether the numbers reconcile at end of day against your point of sale and your merchant statement. Cut over the rest only after you have watched a real Friday night, not a demo.

Read your own contract before any of it

Three clauses decide how expensive this is and all three exist in your current agreement right now. The term and auto-renewal window, which sets the only dates on which leaving is cheap. The data access and termination assistance language, which sets whether getting your own history out is included or quoted. And any minimum commitment or order allotment, which determines whether you are contractually paying for volume you have already moved elsewhere. Pull the agreement and read those three sections before you take a single vendor call. It is the highest-value hour in the whole process and it costs nothing.

The version of this that is genuinely low risk

Almost nobody who contacts us about an enterprise platform ends up replacing the platform, and we think that is the right outcome rather than a disappointing one. The low-risk pattern is to keep the ordering platform doing the thing it is genuinely excellent at, marketplace connectivity and high-volume order transport, and to build the two or three workflows around it that leak money and that no general platform will ever fit: the catering quote flow, the franchisee reporting layer, the guest data work your marketing team currently does in spreadsheets, the operational alerting nobody has time to build. That build does not require a migration, does not put a peak-hours revenue stream at risk, and pays back against the same thresholds as anything else on this page.

Deep dive

The dimensions the price table cannot show.

Eight dimensions, side by side.

DimensionOloA point of sale bundle (Toast, SpotOn, Square)A small-operator ordering platform (ChowNow, Owner.com, Slice, RestauNax)A commissioned build you own
Price transparencyNone. Verified by absence at olo.com; the only public number is $3,387 per location for 2024, from its own SEC filingMixed. SpotOn publishes a full rate card including processing; Toast's pricing page loads but serves no plan figuresGood. All four publish real rates on their own pagesPublished range, $45,000 to $180,000, fixed after a scoping diagnosis
Cost shapePer location per month, with an order allotment and a fee per excess order per Olo's own 10-KPer station or per location, with the real economics in card processingSubscription plus a per-order or percentage fee on most plansOne time, then a maintenance line you control
What growth costs youRises with locations and with order volume above the allotmentRises with stations and with card volumeRises with every order, on percentage plans steeplyNothing. New locations carry no licence
Marketplace connectivityRails: 15 or more marketplace integrations, 99 percent delivery market coverage per Olo's own pageVaries; usually a handful of direct integrationsVaries; often a higher-tier featureBuildable but rarely worth building. This is the strongest reason to keep a platform
ArchitectureOpen middle layer; over 450 technology partner integrations per Olo's own about pageClosed by design; the value is the bundleMostly self-containedWhatever you specify, and you hold the keys
Who it is built forEnterprise, 100 or more locations, and Emerging Enterprise, 5 to 99, per Olo's own segmentationSingle site to mid-size groupsIndependents and small groupsAny size above the payback threshold in the table above
Data ownership and exitYour data inside their schema; exit terms are whatever your contract saysSameSameYours from day one, no export request, no exit quote
Speed to liveReported enterprise onboarding of 3 to 6 months by a competing vendorWeeks to a couple of monthsDays to weeksMonths, and this is the honest weak point

When to pick which, in one paragraph each.

Stay on Olo when your per-location cost is near the filed average, when marketplace volume is material, when your architecture is deliberately best-of-breed, or when you have a date. Four of those six branches in the decision tree end here, which should tell you something about how often the answer is stay.

Move to a point of sale bundle when you are already replacing or renewing the point of sale anyway, when your off-premise mix is modest enough that ordering does not need its own dedicated layer, and when you have decided you would rather have one vendor and one bill than a modular stack. Do it as a point of sale decision that happens to include ordering, not as an ordering decision that drags a point of sale along behind it.

Move to a small-operator platform when you are genuinely small, one to five locations, and your real competitor is not Olo but the delivery marketplace commissions you are trying to escape. Run the percentage arithmetic at your actual volume first, because a $39 plan with a $3 per-order fee is not a $39 plan.

Move to another enterprise platform when the complaint is capability or service rather than price, because you will not be able to verify that you improved on price and neither will anyone else. Go in with a defined evaluation and your own numbers rather than a rate comparison, because there is no rate to compare.

Commission a build when your annual platform spend clears the thresholds above, when you can name the specific workflows, and when you are content to keep the platform doing marketplace transport while you own the parts that are actually yours. That is the shape of most of the good outcomes we see.

Why almost every guide you will find on this question was written by a competitor.

This is worth saying plainly, in buyer terms, because it changes how you should read everything on this subject including this page. When we went looking for numbers on Olo, the specific dollar figures in circulation traced back to three companies, and all three sell a product that competes with Olo. One sells an automation layer starting at $96 a month. One sells an ordering platform at $99 a month and discloses in its own page footer that it builds the product it recommends first. One sells a rival ordering platform. Their estimates for Olo range from $400 a location a month to more than $3,000 a month, and every one of them is higher than the figure Olo filed with its regulator.

None of that makes those companies dishonest. They are writing about the customers who called them, and the customers who call a competitor are disproportionately the ones with the biggest bills. But it does mean the public record on what Olo costs was assembled almost entirely by parties who benefit from the number being large, and it means the single most useful source, the vendor's own audited disclosure, was sitting unused in a securities filing the whole time.

Apply the same suspicion here. We sell commissioned software. That is a direct interest in you concluding that owning beats renting, and you should read every argument on this page with that in mind. Our defence is not that we are neutral, it is that we have printed the threshold below which our own product is the wrong answer, in two separate tables, with the arithmetic shown, and we have printed the one number, Olo's own filed average, that most weakens our case. Check us on it.

What a build alongside your ordering platform actually looks like.

The version that works is narrow and it sits next to what you keep. Four shapes come up repeatedly in restaurant groups.

The catering and large-order flow. Almost every general platform treats catering as an ordering variant with a longer lead time. Real catering is a quote, a deposit, a change window, a delivery logistics problem, a tax treatment and an invoice, and most brands run it half in the platform and half in email. That is a well-bounded build with an obvious owner and an obvious payback.

The franchisee and multi-unit reporting layer. Corporate needs one view, franchisees need theirs, and the platform's export gets rebuilt in a spreadsheet every Monday by somebody whose time is worth more than that. This is the single most common thing we are asked for, across every vertical, and it is usually the cheapest one to fix.

The guest data and lifecycle layer. Order history lives in the ordering platform, guest identity lives partly in loyalty, marketing lives somewhere else, and joining them is a quarterly manual project. Owning the join means owning the asset that actually drives repeat visits.

Operational alerting and exception handling. The order that failed to reach the kitchen, the location that has been out of a top-ten item for six hours, the marketplace whose menu drifted out of sync. Platforms surface this in dashboards nobody watches. A build turns it into a message to the person who can fix it, which is the entire difference.

None of those requires a migration, none of them touches the peak-hours order path, and all of them are inside the fee range on this page. That is why the honest recommendation on most of these calls is keep the platform, own the edges.

How to read Olo's filed numbers yourself, in about ten minutes.

We would rather you checked this than trusted us, and it is genuinely quick. Olo Inc.'s filings are public at sec.gov under central index key 1431695. The annual report is the Form 10-K; the fiscal 2024 one was filed on February 25, 2025 and the fiscal 2023 one on February 21, 2024. The quarterly earnings releases are attached as exhibit 99.1 to Form 8-K filings, and the last one, for the quarter ended June 30, 2025, was filed on August 4, 2025.

Inside a 10-K, search the document for the phrase average revenue per unit. You will find both the definition and a small table of the metric against the prior year. In the fiscal 2024 filing that table reads $3,387 for 2024 and $2,702 for 2023, with ending active locations of 86,000 and 80,000. In the fiscal 2023 filing the same table reads $2,702 and $2,189, with 80,000 and 87,000. Search the same document for the word subscription and you will find the sentence giving the split between subscription and transaction revenue, 45.5 percent and 54.5 percent for 2024. Search for allotment and you will find the sentence about a monthly order allotment with a fee for each excess order.

Two practical notes. Olo's investor relations subdomain now redirects to a parked page following the acquisition, so go to sec.gov directly rather than to the company site for filings. And if you fetch sec.gov programmatically it will refuse a request with no identifying user agent; that is a courtesy requirement of theirs, not a paywall, and a browser has no trouble at all.

Extended FAQ

The eight questions Olo buyers actually ask.

Does Olo publish pricing, or is it always a custom quote?

It is always a custom quote, and we checked that ourselves rather than repeating it. On August 30, 2026 we requested olo.com/pricing and the server returned HTTP 404 Not Found, so no pricing page exists at that path. We then loaded olo.com itself, which returned normally with its full marketing content, and there is no price, no plan name and no dollar figure anywhere on it. The primary navigation is Why Olo, Products, Integrations, Restaurants, Resources, About and Customers. There is no Pricing item in it. The calls to action are Request a Demo and Contact Us. We repeated the check on olo.com/why-olo, on olo.com/solutions/order and on olo.com/rails, and all three loaded and all three publish nothing about cost.

That absence is observed rather than assumed, which matters, because a failed request proves nothing at all. So the answer to the question is settled: Olo prices per brand under a master agreement negotiated with a salesperson, and there is no rate card for you to compare your quote against.

There is, however, one number Olo did publish, and almost nobody looking for Olo pricing has seen it, because it lives in a securities filing rather than on a marketing page. It is covered in the next answer, and it is the most useful figure on this page.

How much does Olo cost per location per month?

Olo never published a rate. It did publish, in its own annual report filed with the Securities and Exchange Commission, exactly how much revenue it collected per active location. Olo calls the metric average revenue per unit, and in its own words it calculates it by dividing the total platform revenue in a given period by the average active locations in that same period. For the year ended December 31, 2024 that figure was $3,387 per location. For 2023 it was $2,702, and for 2022 it was $2,189. Ending active locations were approximately 86,000, 80,000 and 87,000 respectively.

Divide the 2024 figure by twelve and Olo collected an average of $282.25 per active location per month across its entire base. That is the vendor's own number, read directly off Olo's Form 10-K for fiscal 2024 at sec.gov on August 30, 2026, and it is the single most important fact on this page, because every third party estimate in circulation sits well above it. One competing vendor puts the full Olo suite at $400 to $600 per location per month. Another publishes a worked example at $1,850 per location per month. A third estimates $3,000 to $8,000 or more monthly. All three are estimates by companies selling a rival product, and all three are above what Olo actually collected on average.

Now the honest limits, because this figure is a lever and not a quote. First, an average across roughly 86,000 locations is dominated by very large brands buying on master agreements with volume pricing; Olo classifies customers with 100 or more locations as Enterprise and those with 5 to 99 locations as Emerging Enterprise, and a four location chain is nowhere near the scale that produces the average. Second, the figure is total platform revenue, and Olo's 10-K states that for 2024, 45.5 percent of platform revenue was subscription revenue and 54.5 percent was transaction revenue. Applying that split, the subscription portion averages about $128.42 per location per month and the rest is transaction based. Third, part of that transaction revenue is charged to aggregators, channel partners and other service providers rather than to the restaurant, and part of it is Olo Pay, which is card processing that replaces another processor's fee rather than adding to your software bill.

So the correct use of the number is not to say Olo costs $282 a month. It is to walk into a renewal knowing that the average location on the platform generated $3,387 a year for Olo in 2024, and to ask the person across the table why your locations are being asked for a multiple of that.

Why do restaurant operators say Olo is too expensive?

Three reasons come up repeatedly, and only one of them is really about the monthly number.

The first is that the cost is invisible until you are already in a sales process, and then it arrives as a bundle. There is no page to check, no plan to compare, and no way to know whether the quote you received is the same one the chain down the road received. When a category has no public benchmark, every buyer privately suspects they are the one paying too much, and in a category priced per brand under individual agreements, some of them are right.

The second is that the bill grows without a renegotiation. Olo's own filings show average revenue per location rising from $2,189 in 2022 to $2,702 in 2023 to $3,387 in 2024, which is roughly 23 percent and then roughly 25 percent year over year. Olo also reported dollar-based net revenue retention of approximately 115 percent for the three months ended December 31, 2024 and 114 percent for the quarter ended June 30, 2025. Net revenue retention above 100 percent means the same cohort of customers spent more this year than last year. It blends price, additional modules, additional locations and transaction volume, so it is not a published price escalator, and we are not going to pretend it is one. But it is the vendor's own filed evidence that the direction of travel on an existing account is up.

The third reason is a fit problem rather than a price problem, and it is the one most worth taking seriously. A competing vendor writing about Olo alternatives states that enterprise pricing does not justify unit economics below $2M annual digital ordering volume per location. That is a competitor's own directional claim rather than a neutral finding, and we present it as exactly that. It is also the most useful sentence in that article, because it names the real question. Enterprise-grade platform capability priced for enterprise scale is not expensive at enterprise scale. It is expensive at every scale below it.

Does Olo charge a per-order fee on top of its monthly subscription?

For at least some customers, yes, and this is documented in Olo's own words rather than inferred. Olo's Form 10-K for fiscal 2024 states that a portion of our customers purchase an allotment of monthly orders for a fixed monthly fee and pay us an additional fee for each excess order, and that Olo also considers that excess order revenue to be subscription revenue.

That is an order allotment with overage, which is a materially different cost structure from a flat platform fee, and it is the single most important thing to pin down in writing before you sign or renew. The two questions that settle it are what monthly order allotment am I buying per location, and what is the exact per order rate above it. If a salesperson quotes you a monthly platform figure and does not volunteer the allotment, the quote is not a price, it is a floor.

Separately, Olo's 10-K describes transaction revenue that includes fees charged to aggregators, channel partners and other service providers on a per transaction basis for access to the Rails and Dispatch modules. Those fees are charged to the marketplace rather than to you, which is worth knowing when you are comparing the total Olo collects per location against what you personally write a cheque for. Olo's Rails page states that it covers 15 or more marketplace integrations and describes 99 percent delivery market coverage, and it publishes no price.

How does Olo's pricing compare to Toast for online ordering?

Nobody can answer that honestly right now with a verified number on both sides, and any page that gives you a clean comparison is giving you an estimate dressed as a fact. Here is the actual evidence position. Olo publishes no price at all, verified by absence at olo.com. Toast does not hand you a rate card either. On August 30, 2026 pos.toasttab.com/pricing loaded normally, returning HTTP 200, but the document it serves carries only one figure, Toast's own page description saying pricing starts at $0 a month with a custom quote requested. Read in a browser on August 31, 2026 the same page does publish a plan rate, a $0 Starter Kit and a Point of Sale plan starting at $69 a month, because the rate card is assembled in the browser rather than written into the page. pos.toasttab.com/restaurant-pos-pricing returns HTTP 404. A competing vendor writing about this same comparison states in its own article that Toast's pricing page refused two independent checks in its research, so it printed no figure either. Between the two of us, no Toast plan rate has been read off a Toast page.

What circulates in the market, and what we are labelling REPORTED because it comes from review and comparison sites rather than from Toast, is a Toast point of sale base of $0 to about $69 a month with a digital ordering module in the region of $75 a month, before payment processing, hardware and per location costs. We are printing that with its label attached and we are not standing behind it, because a page we could not load cannot support a verified claim.

The comparison that is actually available is more useful anyway. Olo's own filings say the average active location generated $3,387 for Olo in 2024, or $282.25 a month. That number includes payment processing revenue and marketplace fees, so the software-only portion is lower. Any Toast bundle that lands materially above roughly $282 a month per location all in is not the cheaper option against Olo's average, whatever the headline module price says. The honest instruction is to get both quotes in writing, on the same order volume, with processing rates stated, and to compare the totals rather than the list prices.

What is Olo Rails, and is it a separate cost from Olo Ordering?

Rails is Olo's marketplace integration module. Its own product page describes it as connecting third-party marketplaces to your digital platform to make order management easier, synchronising menus, pricing, location data and item availability between your systems and third party sites, and it states 15 or more marketplace integrations and 99 percent delivery market coverage. In practice it is the thing that stops a location running four tablets and rekeying DoorDash orders into the point of sale by hand.

It is a separate module, and Olo sells it separately. Olo's Order solution page lists the modules by name: Ordering, Serve, Dispatch, Rails, Catering Plus, Olo Loyalty, Order with Google, Switchboard and Olo Network. Those are nine separately named modules in one of three suites, alongside Pay and Engage. None of those pages publishes a price.

The cost structure is worth understanding because it is unusual. Olo's 10-K describes transaction revenue that includes fees charged to aggregators, channel partners and other service providers on a per transaction basis for access to the Rails and Dispatch modules. So some of what Rails earns comes from the marketplace side rather than the restaurant side. That does not mean Rails is free to you. It means your quote for Rails and the total economics of Rails are two different things, and the only one you can act on is your quote. Ask for Rails priced as a line item, not folded into a suite total, and ask whether the price moves with your marketplace order volume.

What is the best Olo alternative for an independent restaurant versus a large multi-location chain?

They are completely different answers, and the mistake worth avoiding is reading a list built for one and buying it for the other.

For a genuine independent, one to five locations, Olo is not really your competitor set at all; Olo sells to brands, and its own segmentation starts Emerging Enterprise at five locations. The published-price options that fit are RestauNax at $99 a month with no commission fees and no long-term contracts, SpotOn at $0 per station per month on the All-In plan with a two year term or $55 per station per month on POS Essentials, plus its Core Bundle add-on at $50 a month and 20 basis points of card volume capped at $200, Owner.com at $249 a month plus a 5 percent order fee or $499 a month flat, ChowNow from $229 a month on annual billing plus 2.95 percent and $0.29 per transaction, and Slice at $39 or $399 a month if you are specifically a pizzeria. Every one of those figures was read off the vendor's own pricing page.

For a real multi-location chain the honest list is short, because most of the names above are not built for you. Toast if you are willing to standardise on its point of sale, Lunchbox if you want a like-for-like enterprise platform, Zay-OS if you want a published per location rate card at $399, $499 or $599 a month by tier instead of a custom quote, and Olo itself if the answer to the diagnosis is that you are already getting the average deal or better. The fifth option is the one no platform vendor will put on their comparison page: keep whatever you keep, and commission the two or three workflows that actually leak money as software you own.

The rule of thumb that decides it is arithmetic, not preference. A commissioned build pays for itself inside about two years when your annual incumbent spend is roughly 68 percent of the build price, and inside about five years at roughly 38 percent of the build price, at our stated maintenance assumption. At the floor of our range, $45,000, that means a build beats the subscription inside two years once you are spending about $30,400 a year, and inside five years once you are spending about $16,900 a year. Below that, stay where you are.

What does the Thoma Bravo acquisition mean for Olo customers?

Olo is no longer a public company. Its own site carries the announcement, dated September 12, 2025, that Thoma Bravo completed the acquisition in an all-cash transaction valuing Olo at approximately $2.0 billion in equity value, that shareholders received $10.25 per share, and that the company's common stock has ceased trading and will be delisted from the New York Stock Exchange.

We are going to be careful here, because this is the point on a page like this where a vendor comparison usually reaches for a scare story, and there is no honest basis for one. Nothing has been announced about products, pricing or support changing. Olo's own announcement says nothing about it. We make no prediction about what a private equity owner will do with pricing, because we do not know and neither does anyone else writing about it.

What we can say factually is narrower and still worth planning around. Before the acquisition, Olo filed quarterly and annual reports, and those filings are where the $3,387 per location figure on this page came from. That disclosure stream has stopped. The last quarterly release, for the quarter ended June 30, 2025, reported total revenue of $85.7 million, platform revenue of $84.1 million, average revenue per unit of approximately $955 for the quarter, net revenue retention of 114 percent and approximately 89,000 ending active locations. There will not be a next one. From here forward, the only Olo cost information available to you is the number in your own contract, and the benchmark on this page has a fixed date on it that will get older every year. That is a reason to pull your own numbers now, not a reason to panic.

Buyer worksheet

What to have in front of you before any call.

Seven documents to pull before you talk to anyone.

1. Twelve months of platform invoices. Not the contract, the invoices, because the two frequently disagree. Total them, divide by locations, divide by twelve. That single number decides which branch of the decision tree you are on and you cannot start without it.

2. Your master agreement, with three sections flagged. The term and auto-renewal window. The data access and termination assistance language. Any minimum commitment or order allotment. Those three clauses determine what leaving costs and when leaving is even possible.

3. Your order allotment and overage rate, in writing. If you cannot find them, that is your first question to your account manager, and the answer belongs in an order form rather than an email.

4. Your module list. Which of Ordering, Serve, Dispatch, Rails, Catering Plus, Loyalty, Order with Google, Switchboard, Network, Pay and Engage you are actually paying for, and which of those are genuinely in use. The gap between those two lists is usually the cheapest saving available to you and it requires no migration at all.

5. Your marketplace order share. What percentage of digital volume arrives through DoorDash, Uber Eats and Grubhub. This is the single input that most often ends the conversation with keep the platform.

6. Your digital revenue per location per year. Compare it against the $2M annual digital ordering volume per location threshold a competing vendor names, labelled REPORTED. It is a competitor's directional claim rather than a rule, but it is the sharpest framing anyone has published of where enterprise pricing starts to make sense.

7. The two or three workflows that actually leak money. Written down, named, with a rough hours-per-week estimate attached. If you cannot fill this one in, the answer to build or not is already no.

Seven questions to ask every vendor, including us.

1. What is the price, in writing, per location per month, with every fee named? If the answer requires a discovery call before a number exists, note that and move on to the next question rather than arguing about it.

2. What is the order allotment and what is the exact overage rate? Ask this of every ordering vendor, not just Olo. Any vendor that prices per order under any name has this answer.

3. What is the annual increase, contractually, and what has it actually been for your existing customers? The second half of that question is the one that produces an interesting silence.

4. What is the term, and what is the auto-renewal notice window? A two year term with a ninety day notice window means you have one week a year in which leaving is cheap.

5. On termination, what do I get back, in what format, and at what cost? Get the format named. "A data export" is not a format.

6. What does implementation cost and how long does it take, in weeks, for my location count? Then ask what it took for their last customer at your size.

7. Name a customer of my size that I can call. Ours is Jim Glaser Law and they take reference calls. If a vendor cannot produce a reference at your scale, the honest read is that they do not have one at your scale.

When not to buy from us.

We would rather write this than have it discovered on a call, so here is the complete list.

If your platform spend is under about $16,875 a year, a build at the floor of our range does not pay back inside five years and we would be selling you a worse outcome than the one you have. This is arithmetic, not modesty, and it is printed in two tables above so you can check it without us.

If you are paying at or near Olo's filed average of $282.25 a location a month and you have four locations, the numbers say rent. We put that row at the top of the four-anchor table rather than the bottom for exactly this reason.

If your real need is marketplace integration coverage, 15 or more delivery platforms kept in menu sync, we are the wrong vendor and we will say so in the first ten minutes. That is a platform problem and platforms solve it well.

If you need it live inside four months, buy something that exists. We will not take an engagement we do not believe lands on time.

If you cannot name the workflows, we will not scope it. A build without a specification is how a fixed fee becomes a fixed disappointment, and we would rather have the awkward first call than the awkward fourth month.

If what you actually want is a better deal on the platform you have, take the filed average and the allotment questions from this page into your renewal and keep the 45 minutes. This page will have done its job.

Sources, with dates and labels.

VERIFIED, read off the vendor's own page or filing.

Olo Inc. Form 10-K for fiscal 2024, filed February 25, 2025, read at sec.gov on August 30, 2026: average revenue per unit of $3,387 for 2024 and $2,702 for 2023; ending active locations of 86,000 and 80,000; the ARPU definition; the subscription and transaction revenue split of 45.5 and 54.5 percent for 2024, 44.7 and 55.3 for 2023, 50.9 and 49.1 for 2022; dollar-based net revenue retention of approximately 115 percent for the three months ended December 31, 2024; gross merchandise volume of approximately $29 billion for 2024; more than 750 restaurant brands and approximately 86,000 active locations; the Enterprise and Emerging Enterprise segment definitions; and the order allotment with a fee for each excess order.

Olo Inc. Form 10-K for fiscal 2023, filed February 21, 2024, read at sec.gov on August 30, 2026: average revenue per unit of $2,702 for 2023 and $2,189 for 2022; ending active locations of 80,000 and 87,000; ten largest restaurant customers at approximately 12 percent of revenue for 2023; one customer at 12, 12 and 18 percent of revenue for 2023, 2022 and 2021.

Olo Inc. Form 8-K earnings exhibits, read at sec.gov on August 30, 2026: for the quarter ended September 30, 2024, total revenue of $71.9 million, platform revenue of $71.0 million, ARPU of approximately $850 and ending active locations of approximately 85,000; for the quarter ended June 30, 2025, total revenue of $85.7 million, platform revenue of $84.1 million, ARPU of approximately $955, net revenue retention of 114 percent and ending active locations of approximately 89,000.

olo.com, loaded August 30, 2026: no price, plan name or fee anywhere; navigation of Why Olo, Products, Integrations, Restaurants, Resources, About, Customers with no Pricing item; calls to action of Request a Demo and Contact Us. olo.com/pricing returned HTTP 404 the same day. olo.com/why-olo, olo.com/solutions/order and olo.com/rails all loaded with no price. olo.com/about-us: over 800 brands, 108 million connected guests, approximately 90,000 locations, more than 3.5 million orders per day on average, over 450 technology partner integrations. olo.com/solutions/order: the nine named Order modules. olo.com/rails: 15 or more marketplace integrations and 99 percent delivery market coverage. olo.com's own acquisition announcement dated September 12, 2025: Thoma Bravo completed the acquisition at approximately $2.0 billion in equity value, $10.25 per share, common stock ceased trading and delisted from the NYSE.

get.chownow.com/pricing, owner.com/pricing, slice.com/pricing, spoton.com/pricing, restaunax.com/pricing and zay-os.com, all loaded and read on August 30, 2026, for the plan names and rates quoted in the tables above. squareup.com's restaurant pricing page loaded the same day and showed a free tier plus Plus, Premium and a custom Pro tier, without the monthly figures rendering in our read, so we printed none.

REPORTED, published by a third party or a competing vendor, not by the vendor being described.

ustechautomations.com, read August 30, 2026, a company selling a competing automation product from $96 a month: the $400 to $600 per location per month full-suite range; the four location Dallas burger chain worked example at $1,850 per location per month, $7,400 per month total, moving to $2,100 per month; the unit economics threshold of $2M annual digital ordering volume per location; the middleware and integration-gap claim; the 3 to 6 month onboarding claim; and its own statement that Toast's pricing page refused two independent checks.

restaunax.com, a competing vendor whose page footer states that it builds RestauNax: the estimate of $3,000 to $8,000 or more monthly, $36,000 to $96,000 or more annually, for Olo.

revolutionordering.com, a competing vendor, read August 30, 2026: the statement that the Olo monthly cost may start at $1,000 per month until a certain number of units is onboarded, alongside a deployment fee given as $3,000. Not modelled anywhere on this page.

Review and comparison sites, for Toast's point of sale base of $0 to about $69 a month and a digital ordering module around $75 a month. pos.toasttab.com/pricing loaded on August 30, 2026 returning HTTP 200, with no plan figures in the served document beyond its own page description of pricing starting at $0 a month with a custom quote, and pos.toasttab.com/restaurant-pos-pricing returns HTTP 404, so these figures are not verified and are not treated as such. App directories and press summaries, for Lunchbox at a reported starting point of $300 a month; lunchbox.io/pricing returned HTTP 404 the same day and lunchbox.io itself loaded with no price.

ASSUMPTION, our modelling input, nobody's published figure.

Build maintenance at 17.5 percent of the build price per year, the midpoint of a 15 to 20 percent range. Zero annual escalation on the incumbent in the chart and as the calculator default, chosen deliberately in place of a higher number that would flatter our own conclusion.

DERIVED, arithmetic on verified inputs, shown on the page.

$3,387 divided by 12 equals $282.25 per location per month. $3,387 multiplied by 45.5 percent equals $1,541.09 a year, divided by 12 equals $128.42 per location per month of subscription. The crossover points, cumulative totals and payback thresholds in the model tables, all from the formulas printed alongside them.

What we would change on this page if we learned we were wrong.

Three things on this page could turn out to be wrong, and it is worth saying which, because a page with no stated failure modes has not been checked.

The ARPU reading could be misapplied. We read Olo's own definition, dividing total platform revenue by average active locations in the same period, and we cross-checked the arithmetic against the quarterly figures: platform revenue of $71.0 million for the quarter ended September 30, 2024 against roughly 83,500 average locations gives about $850, which matches the reported quarterly ARPU exactly, and $84.1 million against roughly 88,500 gives about $950 against a reported $955. So the annual figures of $3,387 and $2,702 are annual and the quarterly figures of $850 and $955 are quarterly, and we have not confused the two. If we had, every conclusion drawn from that number would move by a factor of four, which is why we did the check rather than assuming.

The competing-vendor estimates could be right for your segment. If enterprise multi-suite deployments genuinely cost $1,850 a location a month, then Olo's blended average is being held down by a very long tail of single-module locations, and the average tells you less about your quote than we have implied. We think that is likely to be partly true, which is exactly why the four-anchor table exists rather than a single headline number.

Our maintenance assumption could be low. 17.5 percent of build price a year is a modelling input and nothing more. If real maintenance for your build lands at 25 percent, every payback threshold on this page moves against us: at $45,000 the two year threshold rises from $30,375 to $33,750 a year. Get a real maintenance figure in writing before you decide, from us or from anyone.

Bring your last invoice.

Free 45-minute diagnosis, under NDA. We will run your real location count and your real per-location rate against the model on this page, show you where you sit against the $3,387 a location Olo filed for 2024, and give you a straight renegotiate, switch or build answer. A meaningful share of these calls end with us telling an operator to stay exactly where they are.