Home/ Reports/ 2026 Mid-Market CPA AI Benchmark

The 2026 Mid-Market CPA Firm AI Benchmark.

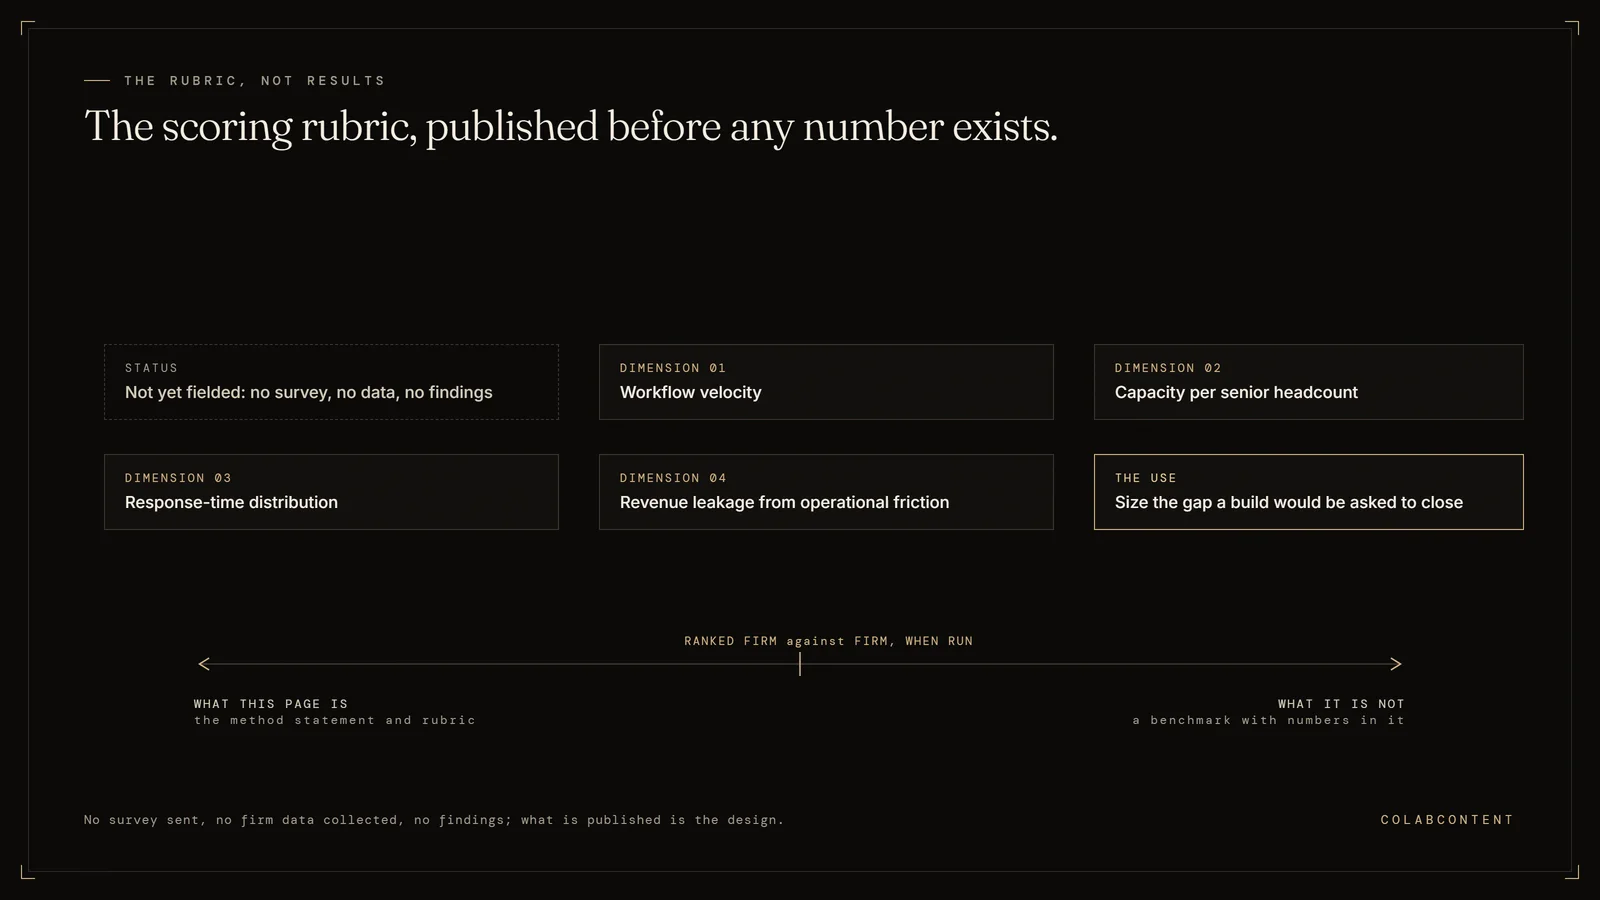
Status: not yet fielded. This page publishes the scoring rubric for a planned benchmark of mid-market CPA firms, not results. No survey has been sent, no firm data has been collected, and there are no findings to report. What is published here is the design: the dimensions we intend to score (workflow velocity, capacity per senior headcount, response-time distribution, revenue leakage from operational friction), how firms would be ranked against each other on them, and how a firm could use its own position to size the gap a build would be asked to close. If a benchmark with numbers in it is what you need today, this is not that document.

The 2026 Mid-Market CPA Firm AI Benchmark rubric: status not yet fielded with no survey or findings, scoring dimensions of workflow velocity, capacity per senior headcount, response-time distribution, and revenue leakage, used to size the gap a commissioned build would close
Four dimensions and a status line: the design ships before the data.

A planned benchmark of AI adoption and ROI in mid-market CPA firms ($8M-$50M revenue, 30-150 pros), to be segmented by firm size band, technology stack (CCH Axcess, UltraTax, ProSystem fx, Karbon), and workflow. The survey instrument has not opened. Field dates are not set, and we will not set them until the waitlist is large enough for the results to mean anything.

StatusRubric published · survey not fielded
Firm data collectedNone to date
Field datesNot set
CostFree

Why this report.

Karbon's State of AI in Accounting is vendor-marketing content, calibrated for the average firm. The mid-market firm with 30 to 150 professionals is not the average. The questions a managing partner of a $24M firm needs answered (how does my firm rank by size band? by tax-software stack? by workflow? what did peers in my band actually get back?) are not the questions a vendor-funded report is structured to answer.

The two pages that go deepest on the products in this benchmark are how Karbon AI compares to a commissioned build and the CCH Axcess API workflow playbook.

That gap is the reason this benchmark is planned. It is not the reason to treat it as if it exists. Nothing has been fielded, so nothing on this page should be cited as a finding about how mid-market CPA firms are using AI. Publishing the rubric before the data is deliberate: a firm can read the scoring design, tell us it measures the wrong thing, and change it before a single response is collected.

What we have actually shipped, and what we have not.

We have not commissioned a build for a CPA firm. There is no anonymized CPA client behind this page and no accounting dataset in a drawer somewhere. Saying so is more useful to a managing partner than a number we made up.

What the practice has shipped sits in adjacent verticals, and those numbers are real. For Jim Glaser Law we run five channel-specific voice agents (PPC, Organic, TV, Meta, LSA) that have handled 3,787 calls and 5,514 minutes, giving per-channel attribution on every answered call; Jimmy takes reference calls. For a 47-attorney litigation firm we commissioned the platform its matter, invoice and IOLTA trust accounting runs on: 13,296 matters, 4,396 clients, 5,684 invoices, trust reconciled byte-identical against the prior system at cutover. A multi-location home services operator is at 1,486 handled calls and 2,203 minutes, a regional third-party logistics operator at 211, a realty firm at 148. Two marketing agencies outsource their AI fulfillment to us. Across the practice that is more than 6,000 live calls handled.

A professional-services firm that bills time, chases documents and lives or dies on responsiveness is a closer analogue to a CPA firm than anything in a vendor survey. It is still not a CPA firm, and we will not present it as one.

What the report will cover.

I. AI adoption rates by firm size band.

Adoption of AI tools (off-the-shelf, custom, internal builds) across three size bands: $8M-$15M, $15M-$30M, $30M-$50M. Workflow-by-workflow: tax-return prep, review, PBC chase, advisory, audit fieldwork, client communication, internal knowledge.

II. ROI realization, segmented and labeled.

For firms reporting AI tool deployment, what hours-back, dollar-impact, or workflow-improvement they measured against a pre-deployment baseline. This will be self-reported, and it will be labeled self-reported everywhere it appears. Any figure a respondent cannot tie to a baseline they actually held will be reported as an estimate rather than quietly averaged in with measured results.

III. Stack effects: CCH Axcess vs UltraTax vs ProSystem fx vs Karbon.

How adoption rates and ROI vary by primary tax-prep stack. Vendor AI roadmap maturity vs custom AI deployment across each stack.

IV. The custom-build vs off-the-shelf split.

Firms that have commissioned custom AI builds vs firms that have deployed off-the-shelf only. ROI differential, deployment time, adoption persistence at 12 months.

V. The leakage map.

Workflow-by-workflow ranking of where mid-market firms report leaking partner hours, and where they report AI recovering them. This ranking will come from the survey responses alone. We hold no audited panel of CPA firms to calibrate it against, so the first edition will be exactly as strong as its response set and no stronger.

How to participate.

If you're a managing partner, COO, or firm administrator at a $8M-$50M CPA firm and want the report when it ships, plus your own firm's position against the cohort, the path is the survey. It will be short, it will be confidential, and no individual firm's answers will appear in the published report or be shown to anyone else.

The survey is not open. There is no instrument to fill in today and no date we are willing to promise for one, because a benchmark fielded to a thin cohort is worse than no benchmark. Join the list below and you will hear from us when it opens, or hear from us plainly if we decide not to run it.

Behind the benchmark

Method, limits, and how to use it.

Planned methodology.

Read this section as a design document. It describes how the benchmark would be built, in the future tense, because none of it has happened yet. There is no CPA data set, no fielded survey, and no aggregate to hand you.

The intended source is a structured survey of firms in the band, answered by the managing partner, COO or firm administrator, aggregated with identifying details removed. It would not be a roll-up of public filings, not a re-publication of a vendor's industry report, and not an extrapolation from one engagement. Where our own commission work informs the question set, that is what it does: it shapes the questions. It is not evidence about CPA firms, and it will not be counted as a response.

The dimensions we intend to score are the ones that surface most often as the binding constraint in diagnosis calls across the verticals we do work in: workflow velocity, capacity per senior headcount, response-time distribution, and revenue leakage from operational friction. They are on the list because an operator can act on them, not because we already know how CPA firms score on them.

One conflict worth naming plainly: we sell commissioned AI builds. A benchmark published by a house that sells the remedy is not independent research, and we are not going to describe it as such. The defense against that is method, not adjectives. When the report ships it will carry the question wording, the response count per segment, and the segments we had to suppress for thin data.

How a firm would read its position.

The design splits responding firms into four quartiles on each dimension. The top and bottom quartiles are the informative ones; the middle two typically sit close enough together that separating them overstates the precision. The output tells a firm where its workflow stands relative to peers in the band, not relative to a theoretical optimum.

The comparison we expect to be most useful is top quartile minus middle quartile on the dimension a firm already knows is its constraint. That delta, expressed in dollars or hours, is the size of the gap a build would be asked to close. Until the survey runs, no such delta exists for CPA firms, and any number you see quoted as one is not ours.

What the benchmark will not say.

It will not say that every firm should be top quartile on every dimension. Some dimensions are not worth optimizing for a given business model. A firm built around complex advisory work for a small number of clients cannot and should not chase the same return-throughput number as a high-volume compliance shop. The benchmark is a yardstick, not a prescription.

It will also not say that AI is the right intervention for closing any specific gap. Some gaps close better with process redesign, some with staffing changes, some with a stack change. We tell an operator on a diagnosis call when the right answer is not AI.

Using the rubric before the data exists.

The rubric is usable on its own, and that is the honest reason to publish it early. A managing partner can take the four dimensions, score the firm against its own records, and find out which one is the constraint without waiting for anyone else's cohort. That is also what happens on a diagnosis call: forty-five minutes, free, ending with the constraint written down in a sentence. What the call cannot do today is tell you where you sit against a cohort of peers, because we have not asked them.

Where to look next.

The reports hub indexes the benchmarks across the verticals we publish in, each labeled with whether it has been fielded yet. The best-by-vertical guides rank the AI consultants and platforms relevant to each vertical. The resources section holds the decision frameworks that the benchmark is meant to feed into.

Extended questions

The questions buyers ask after the first one.

How much of the buy decision should the operator make versus delegate.

The right shape of the buying motion has the operator-owner or operating partner in the room for the diagnosis call. The constraint identification is too consequential to delegate to a department head. The implementation work that follows can and should be delegated; the decision on which constraint a commission addresses cannot.

How to evaluate references the consulting house presents.

Three questions per reference. First, what was the named constraint the commission addressed at this operator. Second, what was the measured result post-handoff, in dollars or hours. Third, does the reference operator still run the system. Vague references on any of those three are flags, and a written case study nobody will put you on the phone with is the biggest flag of the three.

Applied to us: our named reference is Jim Glaser Law, where five channel-specific voice agents have handled 3,787 calls across 5,514 minutes and Jimmy has agreed to take reference calls and refer. We do not have a CPA reference, because we have not commissioned a build for a CPA firm. A prospect in this vertical should weigh that honestly rather than take a nearby vertical as proof.

How a fixed-fee commission scopes overage risk.

The fixed fee is set after the diagnosis call, after the integration depth is named, and after both sides have written the constraint in a sentence. Overages occur when the operator changes the scope mid-build (a different workflow, a different integration, an additional system). Either side can pause the build to renegotiate; neither side absorbs hidden overages without explicit agreement. The default is to ship the original scope and address scope expansion in a separate engagement.

What happens to the system one year after handoff.

The system continues to run inside the operator's cloud tenant. Models, prompts, and integration code are versioned and the operator has the source. When the underlying foundation model improves (a new release from the model vendor, a new open-weight option), the operator can swap the component without renegotiating the engagement. The maintenance shape we recommend at handoff is a quarterly review of the system's outputs and an annual swap of any component that has fallen behind. There is no ongoing fee attached to it.

When the right call is not a commission.

The right call is sometimes a product (when the workflow matches a product's calibration target), sometimes an internal hire (when the operator has a multi-year horizon and enough recurring AI work to keep a salaried person busy), sometimes a Big Four engagement (when the operator is large enough that separating strategy from build makes sense), sometimes no AI right now (when the operator's leading constraint is not actually addressable with AI). We tell prospects when their constraint falls into one of those buckets and route them to whichever path fits. The four-commissions-per-quarter cap is real; the firms that get one of those four slots are the firms where the commission is the right buying motion.

The five-minute fit-check worksheet.

Operators who want to test the fit before booking a diagnosis call can run a five-minute self-check on six questions. First, is the operator's annual revenue in the $8M to $50M band. Second, is there a named workflow where time or money is leaking measurably. Third, has the operator tried an off-the-shelf product and either rejected it or hit a misfit ceiling. Fourth, is the operator comfortable running the system inside their own cloud tenant under NDA. Fifth, can the senior operator commit to forty-five minutes for a diagnosis call. Sixth, is the budget runway for a $45K to $180K fixed fee real this quarter.

Six yes answers means a diagnosis call is worth the forty-five minutes. Three or fewer yes answers means the right next step is probably one of the alternatives. Four or five yes answers means the call surfaces whether the missing one is addressable.

What to bring to the diagnosis call.

Two artifacts make the call substantially more productive. First, a one-page description of the leading constraint, written in the operator's words, naming the workflow and the rough dollar or hour leakage. Second, a list of the systems the operator uses for the workflow (the system of record, the related tools, the integration boundaries). Neither artifact has to be polished. The point is to surface the constraint quickly so the call's forty-five minutes are spent on diagnosis, not exposition.

Vertical context

How to read this rubric for mid-market CPA firms.

The vertical-specific constraint.

Mid-market CPA firms face a seasonality constraint that no other professional services vertical shares at the same intensity. Compliance work compresses into a short window, and the ratio of reviewer capacity to outstanding client-prepared documents becomes the binding constraint on growth.

Our working hypothesis, and it is labeled a hypothesis because we have not surveyed the vertical, is that the leading constraint named by a managing partner or COO in the 30 to 150 professionals band will be reviewer capacity against PBC backlog during the compression window. Testing that hypothesis is a large part of why the survey is worth running. If firms tell us the constraint is somewhere else, that is the finding, and we will publish it that way.

Reading the dimensions that matter most for this vertical.

The rubric scores firms on a set of dimensions, and two of them are the ones we expect to matter most here. The first is PBC turnaround median time. The second is reviewer capacity against open PBC items. We expect these two to separate firms more sharply than the others, and the survey exists to confirm or kill that expectation. What we cannot tell you is the size of the gap between quartiles on either one, because nobody has measured it and we are not going to estimate it for you.

The mechanism a commission follows is the same regardless of the numbers. A firm arrives at the diagnosis call with a leakage it has already measured in its own records but has not solved. The commission addresses one dimension. The dimension translates into a workflow. The workflow translates into a build. A firm can run that sequence today off its own data. It does not need a cohort, and it should not wait for one.

What the benchmark does not say about mid-market CPA firms.

The first thing it does not say is anything at all about how mid-market CPA firms are performing today, because it has not been fielded. Beyond that, it will never say that every firm should be top quartile on every dimension. Some dimensions are not worth optimizing for a specific business model. The rubric is a yardstick, not a prescription. It also will not say that AI is the right intervention for closing any specific gap. Some gaps close better with process redesign, some with staffing changes, some with a stack change. We tell the operator on a diagnosis call when the right answer is not AI.

How to bring this rubric to a diagnosis call.

Score your own firm on the dimensions before the call, using your own records rather than a cohort you do not have yet. Bring those scores to the forty-five-minute diagnosis call and we work through them together. The dimensions where the firm is weakest become the candidates for a commissioned build. The dimensions where it is already strong become leverage points to defend rather than improve. The conversation ends with the leading constraint written down in a single sentence and an honest assessment of whether a custom AI commission is the right buying motion. Plenty of calls end with us recommending an alternative (off-the-shelf product, internal hire, no AI right now) rather than a commission; the four-commissions-per-quarter cap means we only take engagements where the commission is the right fit.

Or skip the report

Run your firm's teardown now.

The 8-minute Tax Season Hours Teardown plus the self-audit PDF. Free, on demand, no waiting for the report.

About this report

This particular page is not a report. It is a published rubric and survey design for a benchmark that has not been fielded. It contains no findings about mid-market CPA firms and should not be cited as though it does.

Methodology, when the survey runs: responses are collected from firms that opt in, aggregated with identifying details removed, and reported alongside the response count for every segment shown. Segments too thin to report will be suppressed rather than published with a caveat in small type. Where a figure is self-reported rather than measured against a baseline, it will be marked as self-reported at the point it appears. We sell commissioned AI builds, which is a real conflict of interest in a benchmark like this one, and it will be disclosed in the report itself as it is here.

About ColabContent: a private AI consulting house in Boston, MA. We commission custom AI for growth-stage businesses ($20M-$200M revenue). Four commissions per quarter. To inquire about a custom commission or sponsor a research engagement, book a 45-minute diagnosis on the contact page.

Citation: if you cite this page, cite it for what it is, a survey design published before fielding. Attribute to ColabContent with the title and URL. We appreciate links back from research, journalism, and operator content, and we would rather be cited accurately than often.